Singapore's Sustainable Development of Jurong Lake District
Highlights
- With ArcGIS, the development team models, visualizes, compares, and communicates the advantages of alternative scenarios.
- ArcGIS helped organize and address the complex sustainability needs of a large-scale redevelopment project in Jurong Lake District.
- A GIS evaluation tool works at multiple scales to address cumulative impact.
The Republic of Singapore is a city-state composed of 63 islands off the southern tip of the Malay Peninsula. It is highly urbanized, with approximately 5.1 million people (as of 2010) living in an area that covers approximately 270 square miles. By comparison, the City of San Diego has a population of 1.3 million people living in an area of 340 square miles. Singapore has finite space, limited water supplies, and no natural resources. Nearly everything in Singapore is imported, whether it is for personal consumption, manufacturing, or construction. The government of Singapore has made sustainable development, the use of renewable energy, and the efficient use of resources primary considerations in all future planning efforts.
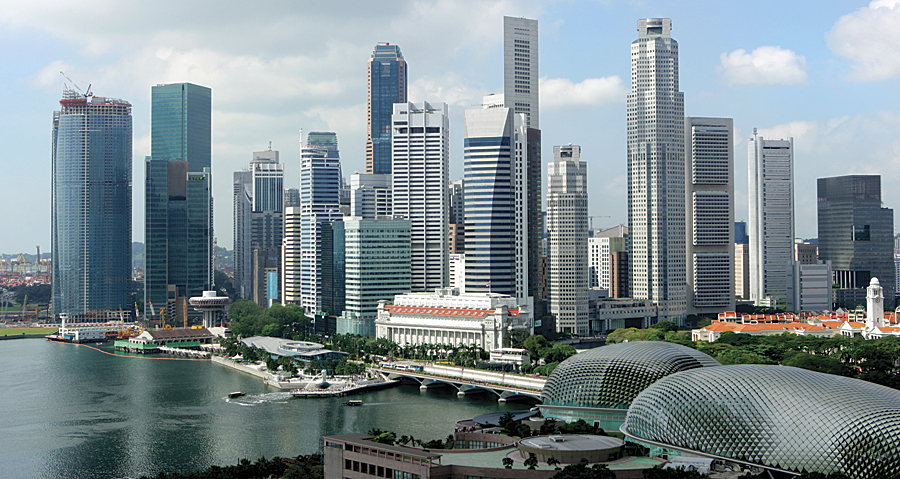
Skyline of Singapore's business district.
Every 10 years, Singapore reevaluates its long-term land-use strategies to ensure there is sufficient land to meet anticipated population and economic growth needs without damaging the environment. Given the high population density and amount of existing urbanization, a strategy of developing and rejuvenating existing buildings is encouraged.
In the 2008 Draft Master Plan for Singapore, the Urban Redevelopment Authority (URA) heralded the Jurong Lake District (JLD) as an ideal place for such redevelopment, referring to it as "a unique lakeside destination for business and leisure." To help with this complex planning effort, URA would use GIS to model, visualize, and communicate the advantages of alternative scenarios.
JLD comprises two distinct but complementary precincts totaling 360 hectares: a commercial hub at Jurong Gateway and a vibrant world-class leisure destination at Lakeside. The 70-hectare Jurong Gateway is planned to be the largest commercial area outside the city center. As outlined in Singapore's Blueprint for Sustainable Development, unveiled by the Inter-Ministerial Committee on Sustainable Development, JLD will be developed as one of Singapore's new sustainable high-density districts. Overall, the aim is to formulate a holistic framework to guide the planning, design, and development of Jurong Lake District, one that considers the environment, the economy, and society concurrently during the decision-making process.
URA proactively included aspects of the sustainability blueprint in the JLD planning efforts, such as the incorporation of landscaped open space and pedestrian park connectors, to heighten the sense of greenery and closeness to nature and increase accessibility to existing transit, public facilities, and venues. Land sale requirements were also put in place to encourage developers to achieve higher Green Mark ratings (Platinum and GoldPlus) for new buildings.
Additional initiatives promote "sky rise" greenery—the addition of elevated parks, gardens, and green roofs on rooftops and skyways; the protection and enhancement of biodiversity; the reduction of resource use through building rehabilitation; and the increase of water catchment and treatment using natural systems whenever possible.
But how were these visionary goals going to be evaluated and translated into reality given the myriad of stakeholders, assortment of variables, and budgetary constraints?
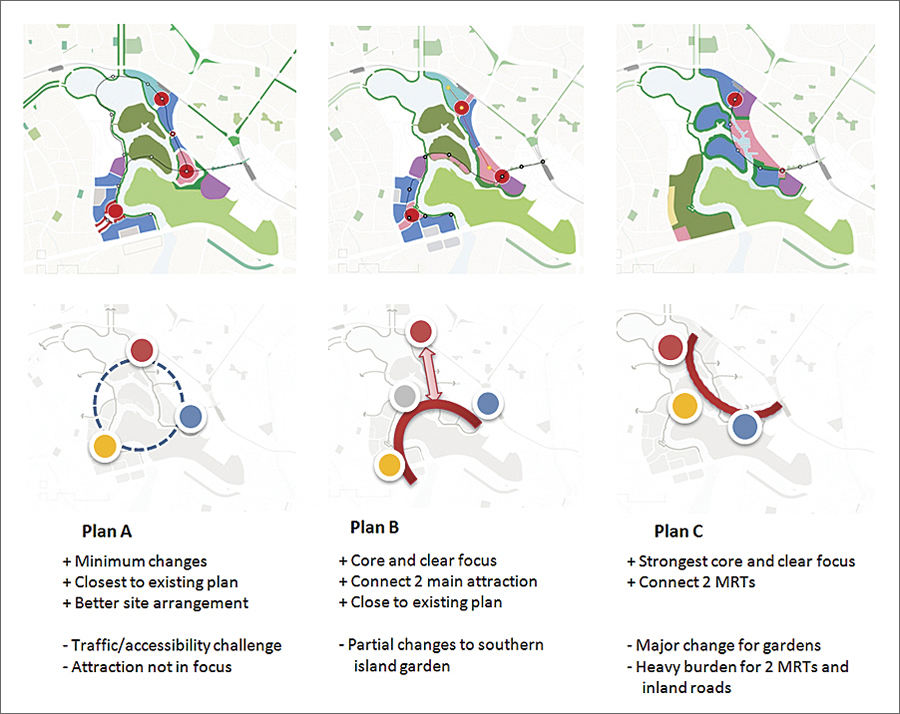
An example of the positive and negative effects of three alternative plans, the last focusing on Singapore's Mass Rapid Transit (MRT).
To assist with this ambitious plan, URA enlisted the help of Esri Partner AECOM (headquartered in Los Angeles, California), which proposed the use of a geodesign framework using ArcGIS to help organize and address the complex sustainability needs for such a large-scale project as JLD.
The Sustainable Systems Integration Model
AECOM's Sustainable Systems Integration Model (SSIM) is a key component of the team's sustainability planning process, providing a platform for rationally evaluating, balancing, and costing a wide variety of sustainability strategies to determine the combination best suited to the economic, social, and business objectives of a given project. The model places ecological enhancement and service components side by side with energy, water, mobility, green building, and sociocultural strategies so that a truly integrated, balanced sustainability program can be measured and conceived. The result is a whole-system economic and GIS evaluation tool developed to work at multiple scales.
The model consists of many steps and techniques that allow users to select the themes and variables most befitting a given project's needs. The framework tracks a set of indicators including total energy use, water demand, waste produced, vehicle miles traveled, and total greenhouse gas (GHG) emissions that can be modeled to show the impact of a single building, block of buildings, or entire community. Various energy or water conservation strategies can be recombined and modeled to show the immediate carbon or water footprint, as well as initial development costs or ongoing maintenance and management costs of a given scheme for any point in the future.
Stage I—Urban Form and Master Planning
Urban form—the physical layout and design of a city, including land use and circulation patterns—has the largest impact on a city's energy use and GHG emissions. Stage I of developing a master plan seeks to identify the best mix of urban form, land-use density, and transportation network to achieve the highest trip capture and reduction in carbon emissions at the lowest cost.
The process started out with a visioning workshop at which all stakeholders and subject experts were brought together to help define and prioritize issues, metrics, and target goals. In this case, the stakeholders were the Building Construction Authority, Land Transport Authority, National Parks Board, National Water Agency, and URA, among others. Participants were encouraged to address problems beyond their field of expertise. The end result of this dynamic interaction and the sharing of views and perspectives across disciplines was an increased understanding among stakeholders of the complexity of key issues, enabling them to reach agreement on priorities.
To create a relatively accurate frame of reference, the team established definitions for business as usual (BaU) and baseline, to which the aspirational targets and all future scenarios could be compared to help the team understand improvements in performance, as well as associated costs (evaluation models). For JLD, BaU was defined as the original master plan in place for Jurong Gateway and Lakeside assuming conventional construction practices. The baseline was defined as the original master plan, combined with the existing sustainable development initiatives already implemented by URA, such as Green Mark certification, the proposed pedestrian network, and the greenery replacement program.
Once the BaU and baseline models were created, alternative master plans (change models) were "sketched" by participants using customized templates or palettes of predetermined land uses, building types, transportation modes, community facilities, and other amenities to help facilitate this process. Sketching was enabled through the standard ArcGIS 10 editing template functionality.
The model's GIS mapping and geoprocessing tools, developed as an ArcGIS for Desktop add-in using ArcObjects, were used to model accessibility to certain plan features, including land-use spatial allocation, internal and external connectivity, and access to key services and transit. A unique addition to the JLD project was the creation of tools to measure the accessibility of vertical components, such as elevated parks, skyways, and trams. These evaluation models, characteristic of a geodesign process, quickly evaluated design decisions, allowing participants to see the impact just by running the tools.
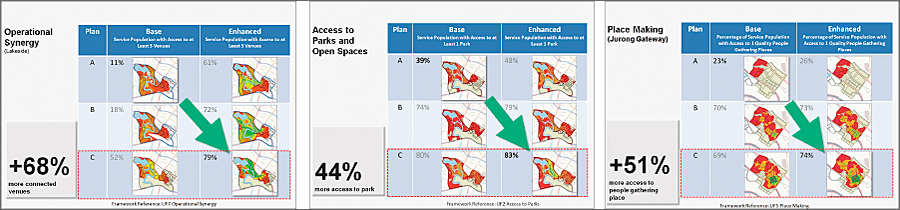
Example of the spatial analyses performed to show the impact of plan changes on different indicators important to the stakeholders. Heat maps created using ArcGIS for Desktop, showing colors from red to yellow to green, indicate good, better, and best for each plan. Plan C shows the highest benefit for each of these indicators.
Stage II—Infrastructure or Primary Systems Evaluation and Modeling
After a preferred master plan framework was selected, a more intensive evaluation of sustainability practices and measures took place, focusing more at a detailed infrastructure level of analysis. By tweaking certain measures—for example, selecting certain building materials or switching to low-flow faucets—additional improvements can be made in water consumption, energy consumption, or cost. This step seeks to answer three core questions for each theme: What energy reduction targets should be evaluated? Which combination of project design features are required to achieve each target? Which combination of project design features will achieve the reduction targets in the most cost-effective manner?
Just like in the evaluation of urban form in stage I, stage II requires the identification of a BaU and baseline for each system (the former being the minimum level of performance allowed by building and zoning codes, while the latter represents the level of performance required by URA in the existing plan). The primary difference between these two was in the amount of open space and green building requirements in the Gateway district. Three additional levels of performance (termed good, better, best), which had been earlier identified in the Sustainability Framework Matrix, were the basis for assembling "packages" of measures that would theoretically achieve each of the respective targets for each system. These packages were then modeled to test whether they in fact achieved the targets.
After identification of the packages of measures to be utilized in closing the gap between the aspirational targets and the current BaU case, each package of strategies underwent a cost estimating step and a cost-benefit analysis.
Stage III—Master Program Optimization
The goal of SSIM stage III is to combine the effects of multiple systems and strategies to create integrated sustainability programs across the entire project site for each of the alternative master plan scenarios refined in stage I. The Gameboard tool of SSIM facilitates this goal by allowing the selection of a performance package for each major system and simultaneously reporting various performance and cost indicators resulting from the package selections.
Gameboard is used to optimize the overall master sustainability program. In this context, optimization is the process of selecting unique combinations of sustainability choices that result in achieving the aspirational targets set out in stage I using a set of predetermined cost thresholds. The optimization process is assisted by a logic engine that solves for the set of constraints stipulated by the thresholds.
Conclusion
In the end, Singapore defined and evaluated three to five master sustainability framework programs. The variation between the programs included multiple combinations of good/better/best scenarios on all the systems. SSIM allowed URA to examine the theoretical 10-year life cycle analysis comparing net present value for each model run.
The savings from energy and water efficiency are expected to offset the investments in other sectors, such as parks, open space, public transportation, potable water infrastructure, and even social programs.
The refined sustainability framework matrix serves as the master checklist for achieving a holistic sustainability program for JLD. It is a living document that will be amended as time goes on and as adjustments need to be made in targets, due to changes in either technology, demographics, costs, or priorities.
For more information about Singapore's sustainable development of Jurong Lake District, contact Matthew Palavido, AECOM (e-mail: matthew.palavido@aecom.com).
For more information on how to put geodesign into practice, contact Mr. Shannon McElvaney, Esri (e-mail: smcelvaney@esri.com), or visit esri.com/geodesign.