Summer 2003
Summer 2003 |
|||||||
|
|
|||||||
In Uruguay, Milk Transportation Uses New GIS and Logistics Tool |
|||||
|
By Mart�n Gonz�lez and Mart�n Mach�n, Business Systems Development Department, IT Division, CONAPROLE
Most dairy farmers in Uruguay are members of the National Cooperative of Dairy Producers of Uruguay (CONAPROLE). CONAPROLE has more than 2,700 milk collecting points and more than 10 depots countrywide. CONAPROLE created the Fresh Milk Management (GLF) project to assure on-time, fresh milk delivery. The technological solution delivers much more than a map; it also calculates dairy farmer payments, offers farmers current information, and provides information about dairy farmers and transport companies to corporate administrators. The GLF project enables data centralization and management in real time, to every user within the company, in a reasonable and suitable format including all pertinent information on the different milk management stages. Routing Problem DescriptionThe state of the art in route planning has evolved surprisingly in the last few years. Once, these tasks were done by logistics departments. Existing, automated route planning systems were very difficult to generalize and apply to other situations. Afterward, as computer calculus and memory storage capacity increased, better solutions to routing problems appeared. Today there are sophisticated tools with varied applications and functionalities. Nonetheless, CONAPROLE's problem is much too complex to adapt to a standard tool. Solutions to find the most efficient and shortest routes to customers are tied to several restrictions (e.g., satisfying all customers' requirements, not exceeding vehicle capacity, starting and ending all routes at the central site). In CONAPROLE's particular case, several issues must be added that make a more complex solution. These issues are
All these issues prompted CONAPROLE to develop a specific application that delivers improved capabilities to planners to achieve their goals. The result is an operating system called GLF-Inforut II, a module that involves all activities related to the GIS operation. Inforut II GIS applications are strongly integrated with the corporate applications. GLF has two-way data communication with SAP R/3. Today, Inforut II is so strongly integrated into the CONAPROLE system that the Uruguayan milk industry cannot operate without using this key GIS technological component. Inforut II was developed with powerful optimization techniques such as heuristics, genetic algorithms, and exact procedures that require graphic interfaces and an important GIS component. To integrate GIS for its complete bulk milk transportation needs, CONAPROLE decided to use ArcInfo and MapObjects, a product with a high integration level with visual tools such as Visual Basic 6.0 and easy programming. Moreover, MapObjects brings a visual tool for working with maps, visualization, categorization, and item and spatial selections. Inforut II monitors milk transport units that send their positions to the central database every minute. Algorithms have been developed in C++, and multiple database connectivity (Microsoft SQL Server, Oracle, etc.) is supported. Application Main Characteristics
Inforut II is an ambitious initiative, developed by CONAPROLE's software development team, based on Esri GIS solutions. The main goal of Inforut II is to deliver to users the best support possible for tasks involving route creation, control, evaluation, and planning for milk collection—to give planners as many tools as possible. The key concept in developing Inforut II is to deliver a tool that works satisfactorily in real situations and in simulation, that is able to work with fictitious scenarios in which some parameters can be changed in the system, and that can help analysts observe possible influences in costs, collecting times, etc. Inforut II integrates user-friendly window interfaces with MapObjects controls where users can
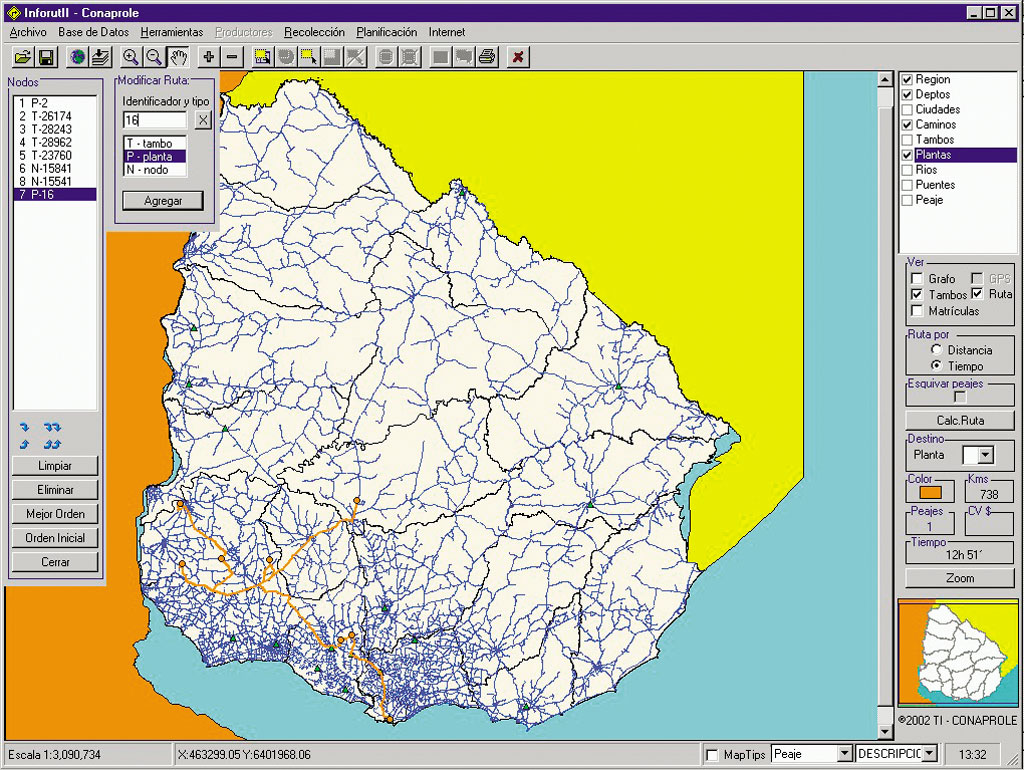
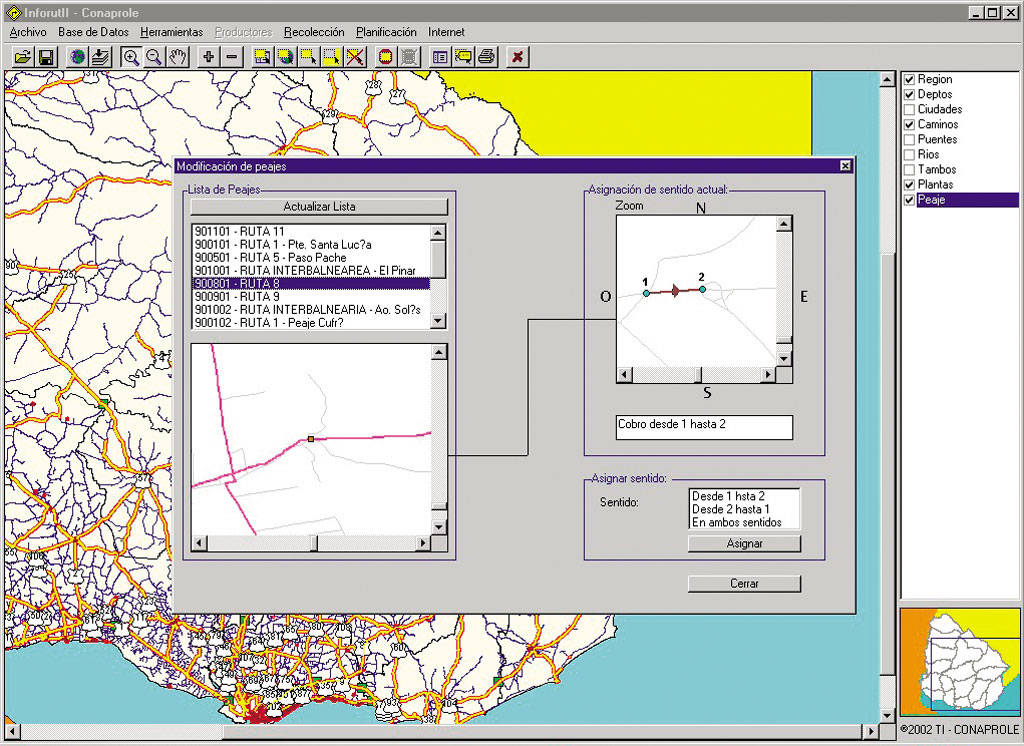
These tasks aid planners in lowering the costs involved in milk collection based on their know-how. How Inforut II WorksInformation Layer Management—Several information layers can be loaded/unloaded while being shown or hidden at the user's convenience. Also, zoom in/out features are available for viewing maps at the desired detail level. Minimum and maximum scales can be set for a specific layer to enable points to appear only when requested by the user. Route Management Utilities—With Inforut II, planners can create routes and evaluate the associated cost efficiently and easily. Real routes can be modified to evaluate costs involved in the change. Updates can add or delete dairy farms, geographic points, toll points for paid routes, changes in destination plants, etc. Route Creation and Display Options—Options for the Inforut II configuration include managing the planning and displaying the results. Users have the option whether or not to display the graph, dairy farms, their affiliate numbers, GPS data, and map routes. These items can be displayed in the map where the dairy farms are inserted, with their affiliate number (key identifier) and the route color highlighted in the map. Some of the most common optimization situations are to minimize distance or time and to evaluate the possibilities of avoiding toll points in paid routes (e.g., search for an alternative route while fulfilling restrictions, thereby saving money by not passing through toll points). Other options are to change a tour destination plant; evaluate how changes cost money and time; and show the route color, kilometers driven, number of toll points, route cost, and time involved for each route. The GPS data and the tracking layer objects included in MapObjects allow the checking of truck movement, trucks speeds, etc. Bulk and Interplant Planning Algorithm—A reassignment of dairy farms to plants can be evaluated. This option does not make routes; it takes previous routes for a specific date and searches a more convenient route with dairy farm reassignment to plants, lowering costs while still satisfying plant demand. Finally, a complete report can be issued showing the new assignment and comparing it with the real one. This tool is meant to use past experience to help the team improve future assignments. Moreover, the map can show dairy farms assigned to different plants. The same query can be done for the real assignment. As both maps could be printed, changes made in Inforut II to get cost differences can be seen. Dairy farms with clearly improved assignments are marked. Inforut II makes these changes in assignment without missing the balance of milk assigned to each plant. From the real assignment, the planned one is deviated a maximum of n liters (parameter n is set by users). For more information, contact Mart�n Gonz�lez, project manager (e-mail: mgonzalez@conaprole.com.uy), or Mart�n Mach�n, department manager (e-mail: mmachin@conaprole.com.uy) at CONAPROLE (www.conaprole.com.uy). |