Summer 2004
Summer 2004 |
|||||||
|
|
|||||||
The Maumee River Watershed in Northwestern Ohio Inventoried With GIS |
|||||||||||
|
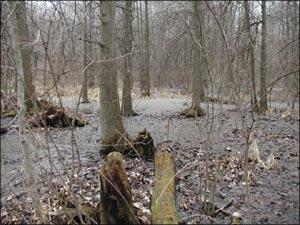
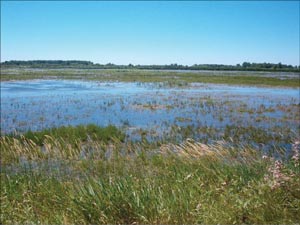
Once considered a nuisance, more than half the United States' native wetlands have been destroyed to make way for new industrial and housing development, waste disposal facilities, and farmland conversion. The statistics are even more startling in the state of Ohio where 90 percent of wetlands have been eliminated over the last 200 years. According to the United States Environmental Protection Agency Web site, "Wetlands help regulate water levels within watersheds; improve water quality; reduce flood and storm damage; provide important fish and wildlife habitat; and support hunting, fishing, and other recreational activities." Fortunately, as the benefits of healthy wetlands are becoming better understood and publicized, attitudes toward wetland conservation are improving.
The Maumee River watershed in northwestern Ohio was designated as an area of concern under the 1987 Great Lakes Water Quality Agreement because of declining water conditions. This area continues to grow and is experiencing urban sprawl and wetlands destruction. The Maumee River Watershed Wetlands Protection and Enhancement Planning Project addresses the need for an accurate wetlands inventory and classification method, which is used as a decision making tool to help halt the destruction of wetlands and improve regional water quality. Authored by Patrick Lawrence, Ph.D.; Nathan Torbick; and Kevin Czajkowski from the Department of Geography and Planning, Center for Geographic Information Sciences and Applied Geographics (GISAG), University of Toledo (Ohio), the study focuses on the Lower Maumee River watershed within Lucas County. To perform this wetland inventory project, the project team turned to Esri's ArcGIS software (ArcInfo) and Leica Geosystems GIS & Mapping's ERDAS IMAGINE software running on Dell PCs with Microsoft Windows XP. The GISAG Research Center has used Esri and Leica Geosystems products for many years and maintains site licenses.
According to Lawrence, an assistant professor of geography and planning, "Recent Landsat 7 Enhanced Thematic Mapper Plus satellite imagery from the OhioView Remote Sensing Consortium was utilized within ERDAS IMAGINE software to inventory wetlands by identifying the main wetland classes and their distribution." A GIS rule-based decision tree algorithm was designed to classify four primary wetland types of interest: forest, prairie, riparian, and coastal wetlands. Landsat scenes from 2000 through 2003 were used to observe and capture changes in vegetation over the growing season. Vegetation changes, cloud coverage, and overall image quality were examined. Seasonal scenes were selected and stacked using IMAGINE Model Maker to create stacked multitemporal images. The project team performed a series of classification processes. The initial effort began with unsupervised classifications. In many land cover classifications, the spectral signals of the terrain are relatively easy to separate and classify. However, in this study the first classification attempt returned inaccurate data because the spectral reflectivity of the vegetation cover in each wetlands class was too similar. Nathan Torbick, a graduate student in geography and planning at the University of Toledo, determined that an advanced classification technique using IMAGINE Expert Classifier, a tool used to build and execute expert systems for image classification, post classification refinement, and advanced GIS modeling, was required. IMAGINE Expert Classifier has two main components, Knowledge Engineer and Knowledge Classifier. Torbick explains, "Using Knowledge Engineer, we defined variables, confidence values, rules, and classes of interest within a hierarchical decision tree framework to create an expert knowledge database. We used ERDAS IMAGINE's Inquire Cursor function and Signature Editor to extract precise pixel values and signatures to identify the wetland types for the area of interest (AOI). Knowledge Classifier then allowed us to apply the knowledge database to the Landsat data and produces an accurate map of wetland species distribution."
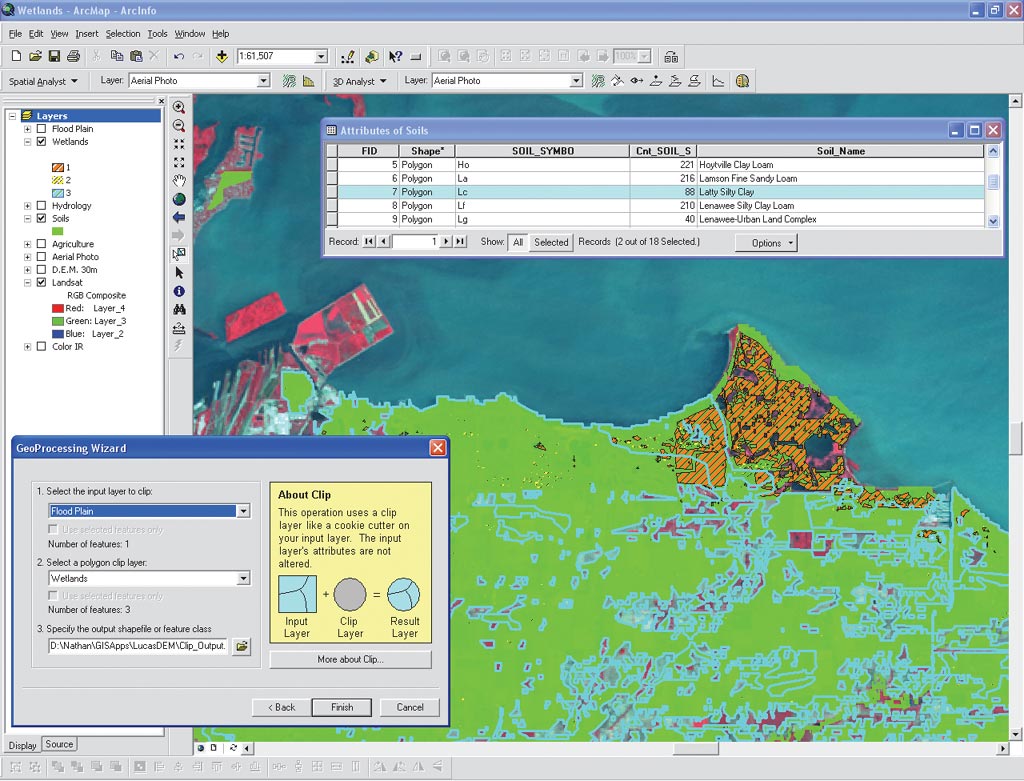
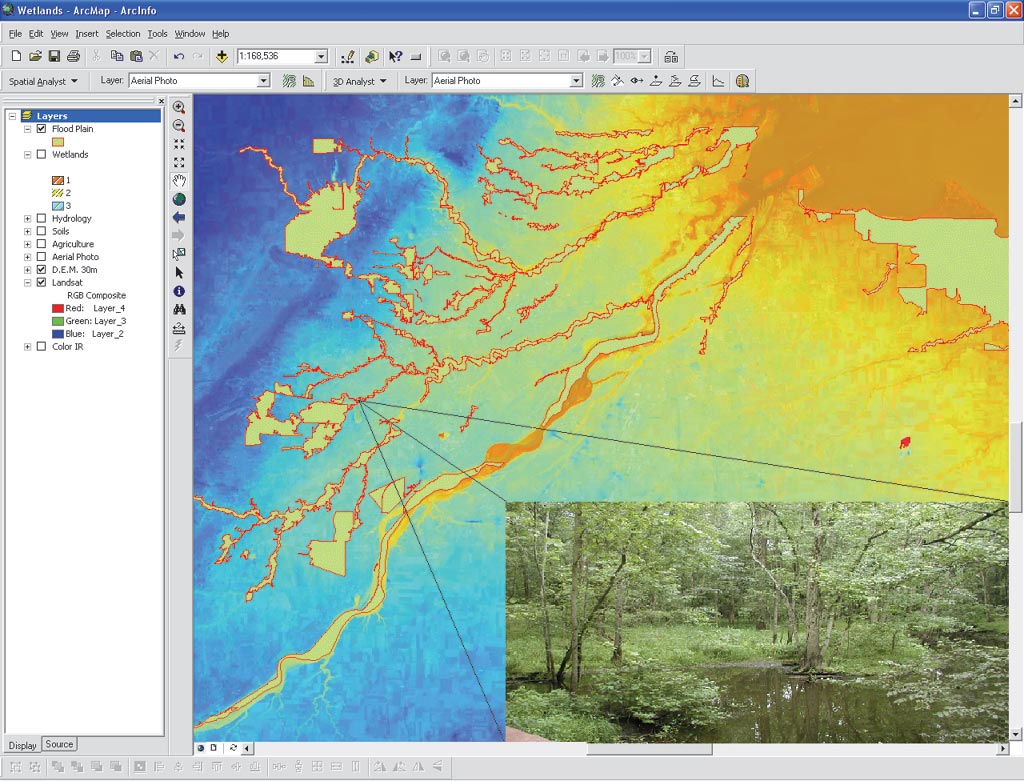
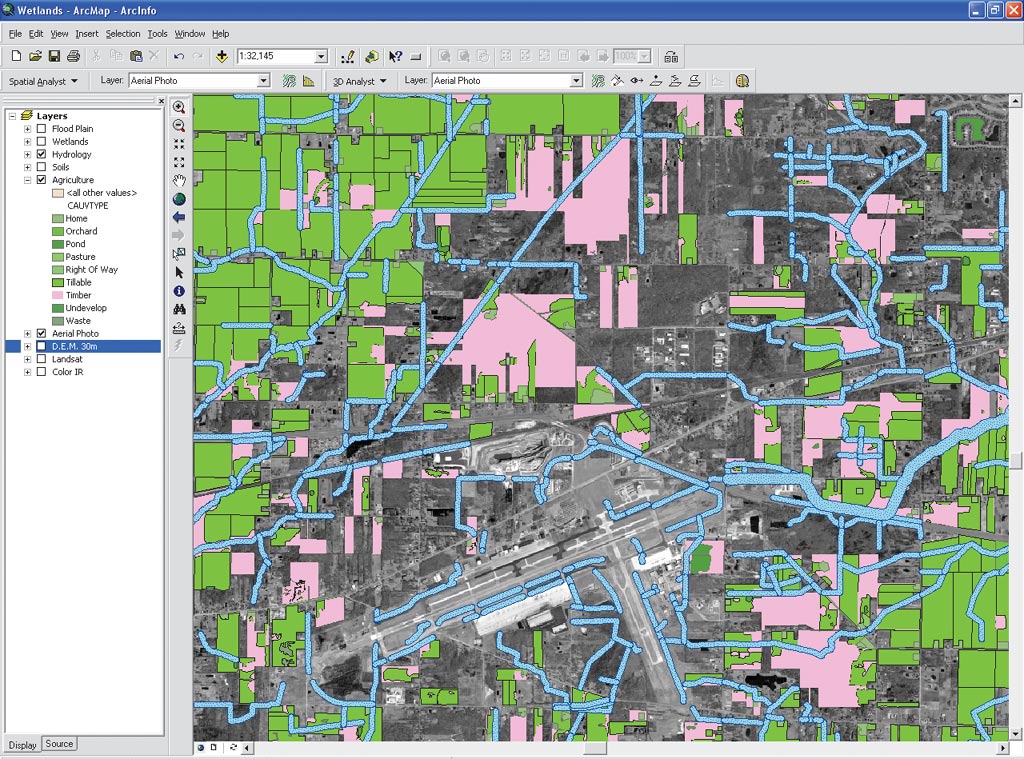
Using ArcInfo, the resulting classified Landsat imagery was integrated with GIS data to create a comprehensive wetlands GIS that includes spatial information on all wetlands-related attributes. Coverages include a variety of information ranging from soils to hydrology to water table information. Selected data layers are served on the Web using ArcIMS at the project Web site (www.wetlands.utoledo.edu). "The integration of remotely sensed data with GIS information has been advantageous for improving wetlands classification," states Lawrence. Drainage data was created using 30-meter digital elevation models (DEMs) provided by the United States Geological Survey (USGS). Multiple DEMs of the study area were combined using the Geoprocessing Merge tools in ArcInfo. Next, unit conversions were performed using the raster calculator in ArcGIS Spatial Analyst to convert values into metric units. Torbick states, "ArcGIS Spatial Analyst and Arc Hydro provide excellent capabilities for hydrography analysis. Slope, drainage areas, flow direction and accumulation, and surface terrain were all examined as possible wetland influencing parameters." "Both 100-year and 500-year floodplain maps and flood hazard areas were joined together using ArcGIS to create one continuous floodplain shapefile for analysis," explains Torbick. Land use within the floodplain was examined to identify mitigation sites and areas of potential wetland restoration as well as to perform inventory analysis. The identification of riparian wetlands, those located along river and stream banks, required a special approach. USGS topographic quadrangles and county drainage maps were obtained and digitized to create a surface hydrology map. Torbick adds, "Using ArcGIS Geoprocessing tools, a 60- or 90-meter buffer was applied to the hydrology polylines to create buffer zones used to quantify riparian areas." The regional governments in northwestern Ohio maintain agriculture land use spatial data. Lawrence explains, "The Current Agricultural Use Valuation is an incentive tax-based program in which registered landowners pay taxes on current agricultural use instead of the land's development potential. This agricultural land cover data was incorporated into the classification model. For the purpose of this study, any land registered as a tillable agricultural parcel, a total of 82,727 acres in Lucas County, Ohio, was eliminated from the AOI."
Torbick adds, "Soils are a fundamental component of wetlands science and regulation." Soil data layers were obtained from the Ohio Department of Natural Resources (www.dnr.state.oh.us/gims). Using the United States Department of Agriculture, Natural Resources Conservation Service, Soils Conservation Service guidelines, ArcGIS was employed to query soils with hydric conditions. Specific soil types were identified based on detailed attribute data and were used to create refined AOIs to enhance the classification model. This reduced the initial AOI by approximately 50 percent to a total of 103,017 acres. According to Lawrence, "Developing a refined AOI was a central step in the project. A highly developed AOI reduces computer storage needs, increases processing speeds, and was found to increase map accuracy. Integrating GIS components and data to develop an AOI increased map usability and decreased possible misclassifications." The Knowledge Engineer output database produced 1,200 aces of wet prairie, 3,200 acres of wet forest, and 1,000 acres of coastal wetlands. The overall classification accuracy was 94.5 percent. Accuracy assessments on optimal output products were conducted. Wetland prairies proved to be the most difficult to accurately classify with a user's accuracy of 83.33 percent. According to Lawrence, "Several confidence iterations and variations of the knowledge database were developed. The accuracy points were checked using aerial photography, expert assessments, and field ground-truthing. Site descriptions, land cover, vegetation communities, GPS locations, digital pictures, soil type, and associated variables were collected for each point."
Torbick adds, "Through this project, a wetlands GIS database that identifies potential high-quality wetland sites was produced. The data is used by local planning authorities, cities, townships, and conservation agencies involved with wetland preservation and mitigation." The use of remote sensing and GIS has contributed to an improved classification, identification, and inventory of main wetland types and sites within northwestern Ohio. "The ability to prepare a wetlands map with a high degree of accuracy has several important implications for urban land use planning and decision making. The results provide for a greatly improved understanding of the types and distribution of wetlands in this region, which is undergoing rapid urbanization. The resulting development places increased pressure on existing wetland features and other areas where wetland restoration would be possible but difficult because of conflicting land uses and a traditional lack of knowledge, information, awareness, and appreciation of wetlands," explains Lawrence. A series of workshops and educational outreach programs are informing potential users about the wetlands GIS database and increasing awareness of wetland issues in the region. The project Web site allows public access to the project's data products and supports public education and awareness. The project methodology will be reapplied to subsequent Landsat images in future years to allow for continued wetland monitoring and investigation. For more information on the Maumee River Watershed Wetlands Protection and Enhancement Planning Project, contact Dr. Patrick Lawrence, Department of Geography and Planning, Center for Geographic Information Sciences and Applied Geographics, University of Toledo (e-mail: plawren2@utnet.utoledo.edu), and/or Nathan Torbick, now at the Department of Geography, Michigan State University (e-mail: torbick@msu.edu). Visit the project at wetlands.utoledo.edu or the OhioView Remote Sensing Consortium at www.ohioview.org or the EPA wetlands Web site at www.epa.gov/owow/wetlands/vital/wetlands.html. For more information on spatial solutions, contact Leica Geosystems GIS & Mapping (toll free in the United States: 1-877-463-7327, outside the United States: 404-248-9000), Web: www.gis.leica-geosystems.com). |