Summer 2006
Summer 2006 |
|||||||
|
|
|||||||
Kernel Density in Nicaraguan Health Facilities |
|||||
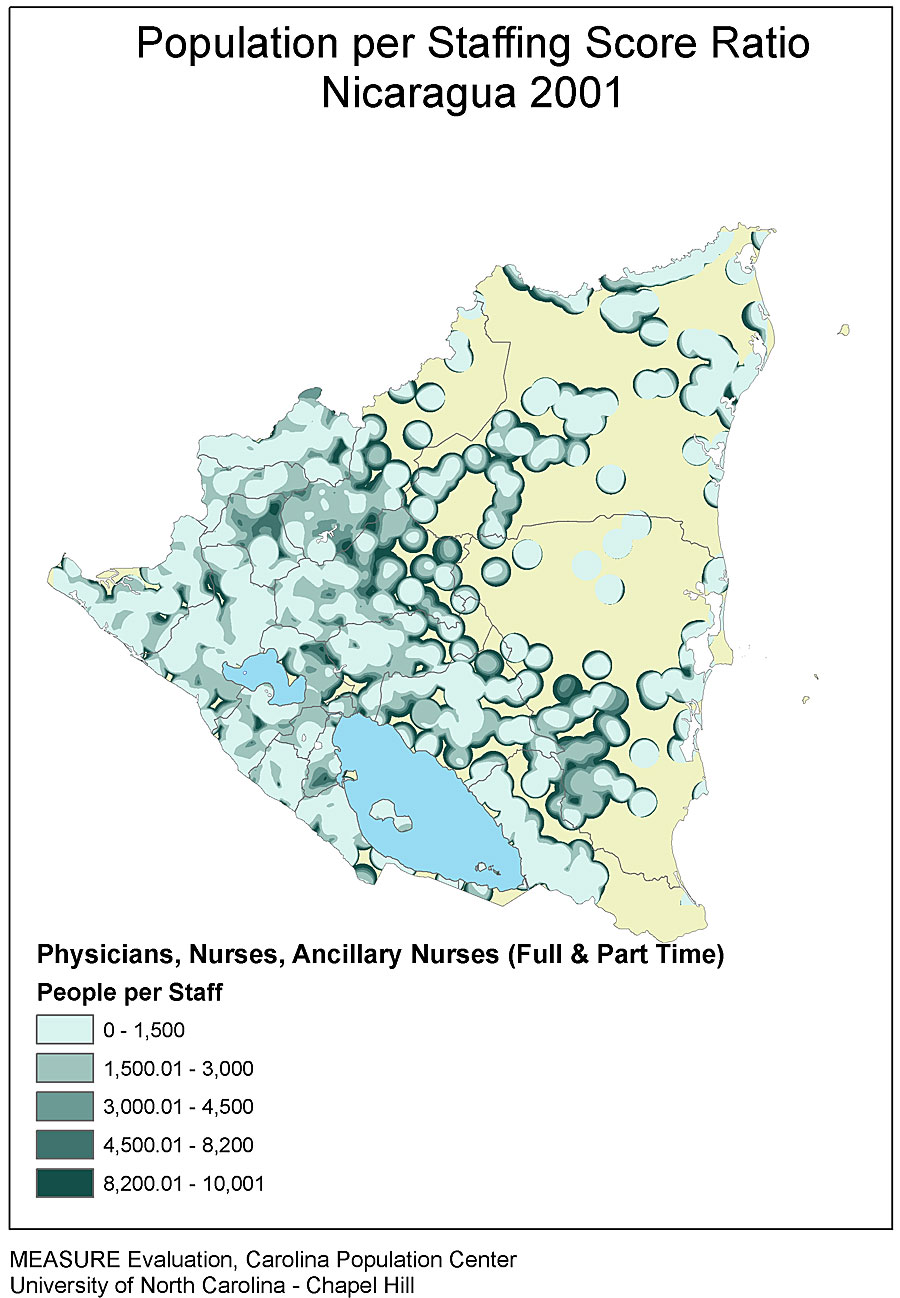
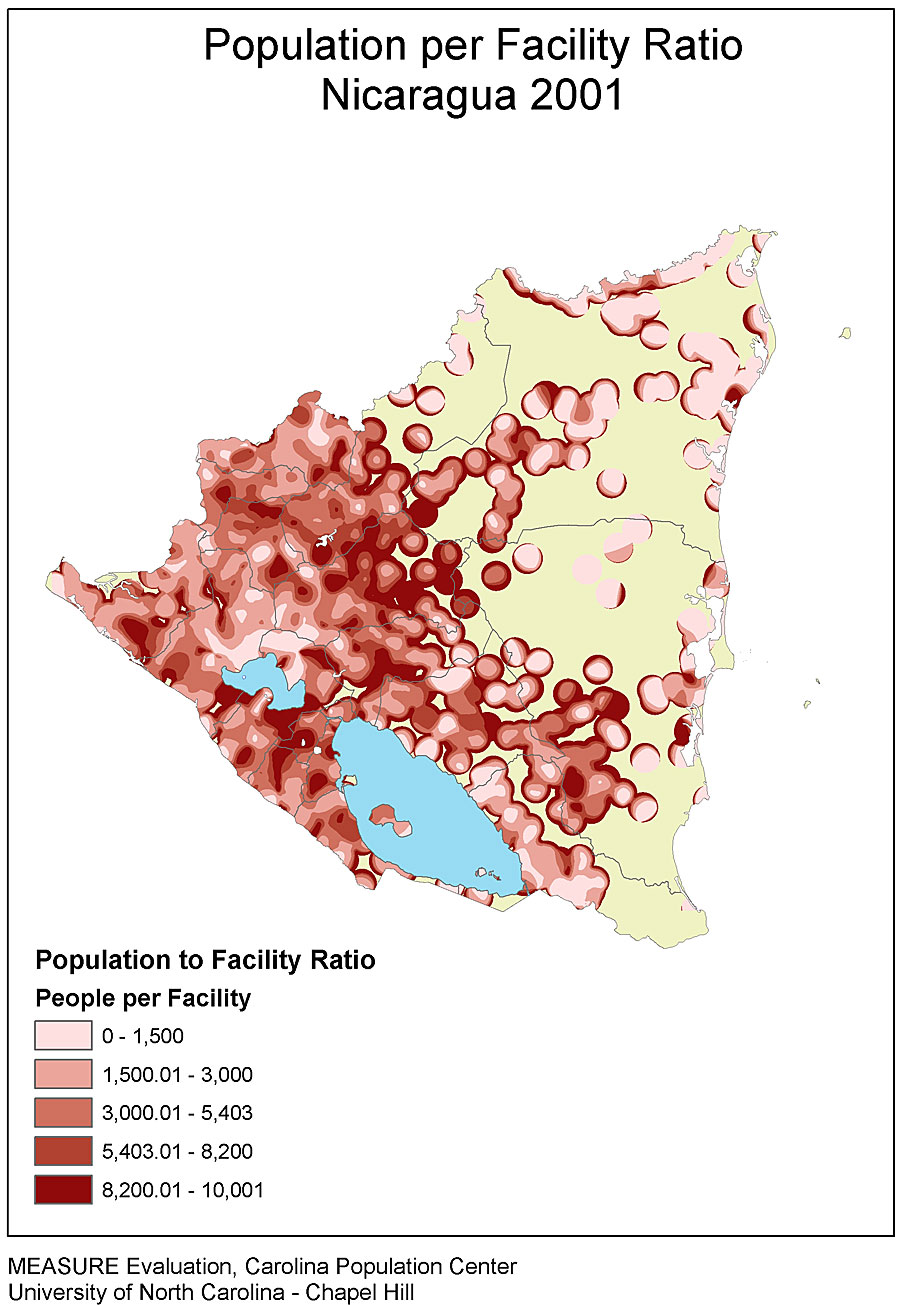
In 2001, the Nicaragua Ministry of Health conducted a census of the nation's health facilities in partnership with the Monitoring and Evaluation to Assess and Use Results (MEASURE) evaluation, a project from the United States Agency for International Development (USAID) that advances monitoring and evaluation of global health programs. Survey teams collected information about the facilities' services and staffing and used GPS receivers to collect latitude and longitude coordinates for every facility they visited. Today, this data continues to help planners in Nicaragua analyze health accessibility and availability of services in the country. Researchers at the Carolina Population Center at the University of North Carolina, Chapel Hill, recently completed a secondary analysis using the facility data. To evaluate facility accessibility at a national level, they used ArcInfo software with kernel density estimation (KDE) available in ArcGIS Spatial Analyst. KDE is a technique for calculating the density of a phenomenon across space. KDE turns discrete point data into a continuous surface of values, spreading the effect of phenomena across space. The new analysis used two key layers of information. The first was the location of the health facilities using the georeferenced file for every health facility in the country. Because the 2001 facility survey collected a considerable amount of data—much more than was necessary for the analysis—the dataset was pared to include only the staffing information at each facility. This subset included the number of full- and part-time physicians, nurses, and nurse assistants. From those numbers, a staffing score was developed to equal the total number of full-time physicians, nurses, and nurse assistants plus one-half the number of part-time physicians, nurses, and nurse assistants. This dataset was joined with the GPS data file using each facility's unique identification. The second dataset used was the location of communities. This file was provided by the Nicaragua Census Bureau and contained the location of all communities in the country as well as the 2001 population estimates for each community. In the context of health facilities, the result using KDE is a type of service area. For instance, a health facility has an area of influence associated with it. This area is affected by a variety of factors, such as staffing, services offered, and beds provided. The facility will have a greater influence on nearby areas than on areas farther away. KDE can be used to distribute the staffing levels of a facility across an area, producing a density of health staff. Furthermore, KDE can distribute the staff in such a way that the areas closer to the facility are given a greater percentage of the staff score than areas farther away. Similarly, communities are no different from facilities in that a point does not adequately represent the population in the community. People are dispersed across the landscape, typically with a greater percentage of people near the center of a community than on the periphery. KDE can be used to model this as well.
Applying a search radius of 10 kilometers, ArcGIS Spatial Analyst was used to create KDE maps of facilities and staffing using the health facility shapefile and of population using the community shapefile. The result was three maps showing, at a national scale, the number of facilities per square kilometer, the staffing score per square kilometer, and population per square kilometer. Next, the ArcGIS Spatial Analyst map calculator function was used to divide the facility staffing density map by the community density map to produce a population-per-staff map. In addition, the facility density map was divided by the community density map to produce a population-per-facility map. The resulting maps can be used to assess areas with high population-to-facility ratios or high population-to-staff ratios. For more information, contact John Spencer, senior spatial analyst, Carolina Population Center, University of North Carolina, Chapel Hill (e-mail: john_spencer@unc.edu). |