Summer 2006
Summer 2006 |
|||||||
|
|
|||||||
High-Tech Mapping in New York City
Putting Trains Back on Track |
|||||
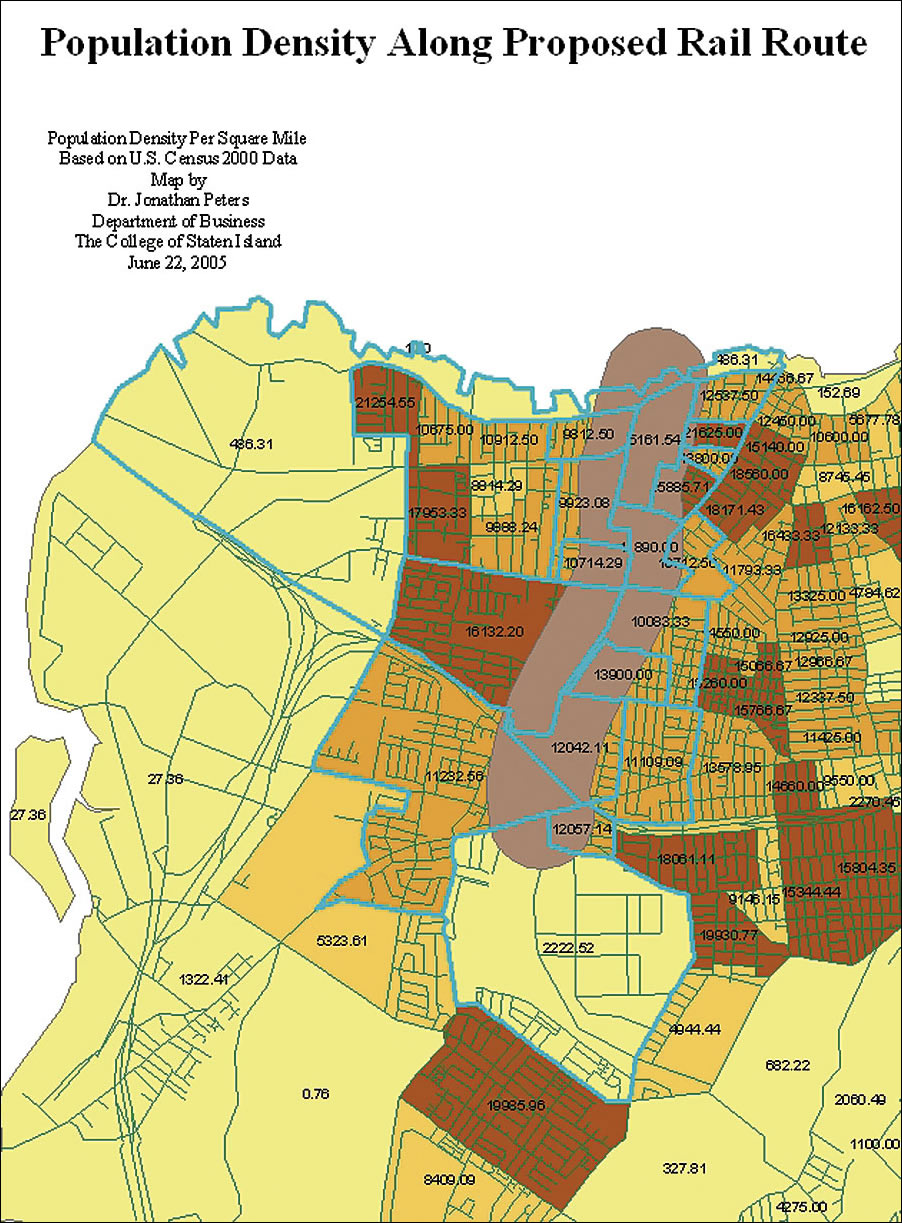
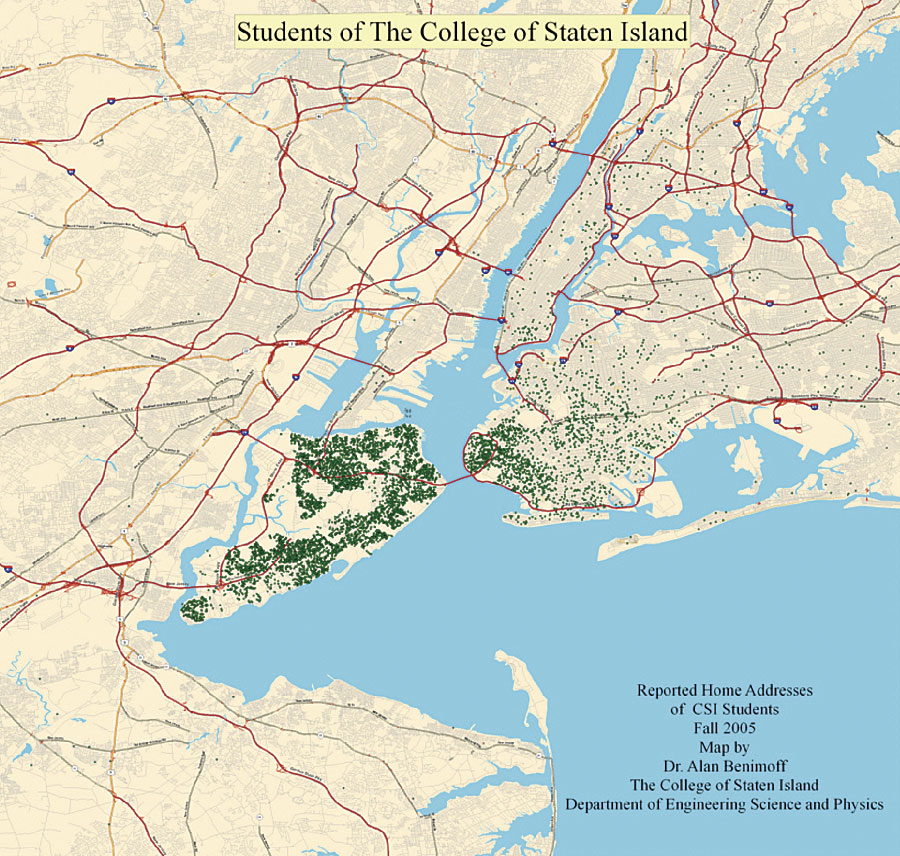
Today, the four outer boroughs of New York City trade places on a regular basis as to which one of the four has the worst commute in the nation. These outer boroughs all have average commutes to work of more than 40 minutes and all are at least 8.5 percent longer than the next worst county in the country—Prince William County, Virginia. In fact, the outer boroughs have commutes that are 74 percent longer than the United States average of 24.6 minutes, and 8 of the 13 worst commutes in the United States are located in the New York metropolitan region. This situation motivated CSI to partner with both the borough president of Staten Island as well as the University Transportation Research Center�Region II of the U.S. Department of Transportation to study the situation and search for possible improvement to the transportation network. The vice president of Information Systems at the college, Dr. Michael Kress, with the financial help of the borough president of Staten Island, deployed ArcGIS Desktop software (ArcInfo) as one of the critical analysis tools. Staten Island, unlike the other four boroughs, was never incorporated into the New York City subway system. Plans to attach to the subway at Brooklyn were made in the 1920s, and construction actually started but was abandoned prior to World War II. Subsequent construction of the Verrazano Narrows Bridge to Brooklyn in 1964 as an automobile-only facility further stimulated auto-based development and the population increased dramatically. Staten Island remains the only borough in a 50-mile radius of New York City without a rail link to Manhattan. Therefore, the GIS efforts included studying existing bus service to search for optimal routes, studying the quality of passenger waiting amenities, and reviewing travel flows in the region and rail and bus route expansion possibilities. First and foremost, a college needs to get its students to and from classes. CSI typically serves students from Staten Island and south Brooklyn. Students traveling from Brooklyn currently face a $9.00 round-trip bridge toll. Dr. Alan Benimoff of the Department of Engineering Science and Physics utilized ArcInfo to locate and map every student who was currently enrolled. He found particularly heavy concentrations of students in Staten Island and in southwestern Brooklyn. The college is currently finalizing these maps so that they can be shared with the local transportation authority in support of expanded bus service to the dense corridors of student residential locations in Brooklyn. In a second usage of GIS, the potential ridership on a proposed extension of a new light rail line, the Hudson Bergen Light Rail in New Jersey, into Staten Island was evaluated based on existing population density along the rail corridor. In this case, the college GIS team, under the direction of Dr. Jonathan Peters, associate professor of Finance, laid out the potential rail route using the draw function in ArcView software's ArcMap application. This allowed them to calculate the length of the proposed rail line, evaluate the potential value of various stops, and establish that the proposed rail line will serve a community that has significant population density. Here, the map explores population density along the proposed line. The general standard in terms of ridership is that a community needs a population density of about 10,000 people per square mile along a route to produce adequate ridership for a rail-type system. Here, one can clearly see that this route has an existing average population density of 10,590 people in tracts that are within one-fourth mile of the proposed route. This indicates that the proposed route is a strong candidate for actual construction and that ridership should meet or exceed the national acceptable standard of 7,500 riders per day on a light rail line.
Finally, to better grasp the changing nature of commuting patterns in the region and locate corridors with potential for mass transit development, Peters created county-specific maps of commuting that portrayed both historical bidirectional patterns of commuting as well as spatial changes over time. In this example, the bidirectional daily worker who flows into and out of Queens is portrayed. What is interesting to note is the significant movements of workers to Brooklyn and Nassau County, Long Island. While Manhattan remains the core for employment in the region, there has been little growth in commuting to Manhattan from any of the outer boroughs in the last 20 years. The College of Staten Island has found that ArcGIS has proven to be an excellent analysis tool that has provided many useful insights into the transportation needs of the community. The college continues to develop other GIS applications that will allow it to delve deeper into the commuting patterns of the region. Dr. Jonathan Peters is associate professor of Finance, the College of Staten Island, and research fellow, the University Transportation Research Center�Region II; Dr. Michael Kress is vice president of Information Systems, the College of Staten Island; and Dr. Alan Benimoff is a member of the faculty of the Department of Engineering Science and Physics, the College of Staten Island. More InformationFor more information, contact Dr. Jonathan Peters, associate professor of Finance, the College of Staten Island (e-mail: jpeters@mail.csi.cuny.edu). |