Summer 2007
Summer 2007 |
|||||||
|
|
|||||||
Real-Time Tracking of the Washoe County, Nevada, 2006 General Election |
|||||||
|
By Kobe Harkins and Matthew Lawton, Technology Services Department—GIS Division, Washoe County, Nevada Highlights
The November 7, 2006, general election in Washoe County, Nevada, saw 120,620 registered voters cast their votes on 54 races and 11 ballot questions. Television, radio, and various Web sites monitored the results live throughout election night. As polls closed and ballots were counted, a new method of tracking the election was also available. Like other information outlets, the 2006 Washoe County Live Election Mapping Web site monitored vote counts, but it also gave viewers the additional component of real-time updated maps at the voter precinct level. Static election maps have become very popular over the past several years but were often not available for days after the election. Viewers of the Live Election Mapping Web site were able to monitor dynamic maps as the results were counted. Like many counties or parishes in America, Washoe County migrated to an electronic voting system in 2004. The county uses the Sequoia Voting System, which consists of stand-alone electronic voting machines. Voters place a voter access card into these machines and, through a succession of interactive screens, make their choices via touch screen technology. Each machine tallies the electronic ballots on a memory card that is then returned to the Registrar of Voters office as the polls are closed. During the 2004 election, the concept of integrating the election results with a GIS application was envisioned by Washoe County manager Katy Singlaub. After consultations with Dan Burk, the registrar of voters, and Thomas Lo, the GIS manager, the decision was made to pursue an online GIS application for the 2006 general election. The Washoe County Technology Services Department was tasked to devise a way to access the secure voting system and provide results online in real time. A workflow was developed by Brian Takemoto, senior technology systems developer, to export the tallied election results into a Microsoft SQL Server database running ArcSDE. Initial testing of the application occurred in August during Nevada's primary election. At the time, the Web site tracked a portion of the primary races and was only available internally to staff and management. The Web site performed well during the primary and was so well received by election staff that a decision was made to develop a complete election-monitoring application available to the public for the November 7 general election. On election night, the public was able to monitor the progression of each race and ballot question by precinct on a map as the results were tallied.
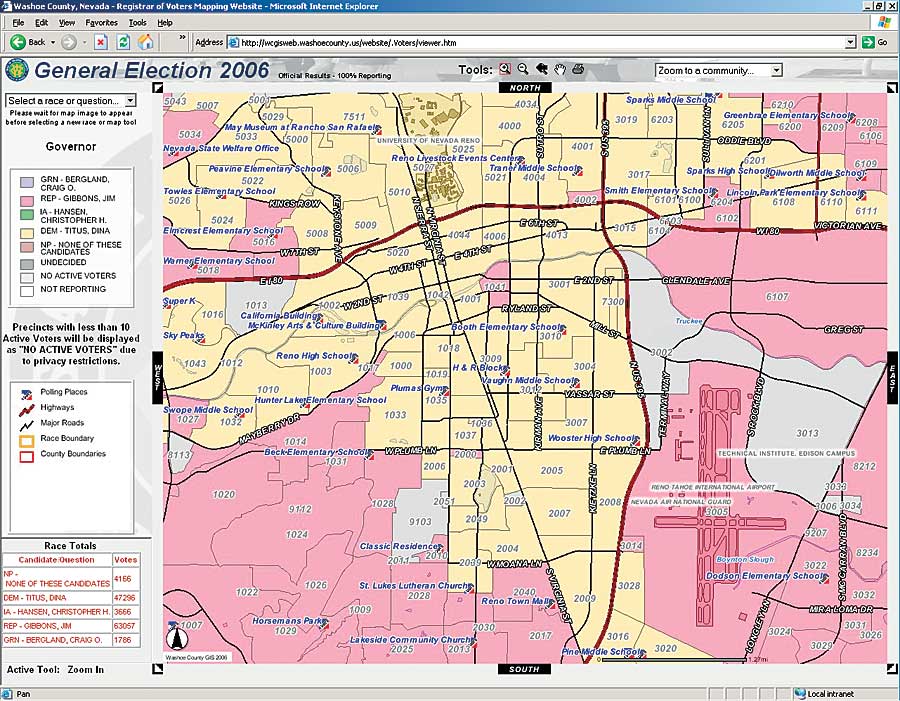
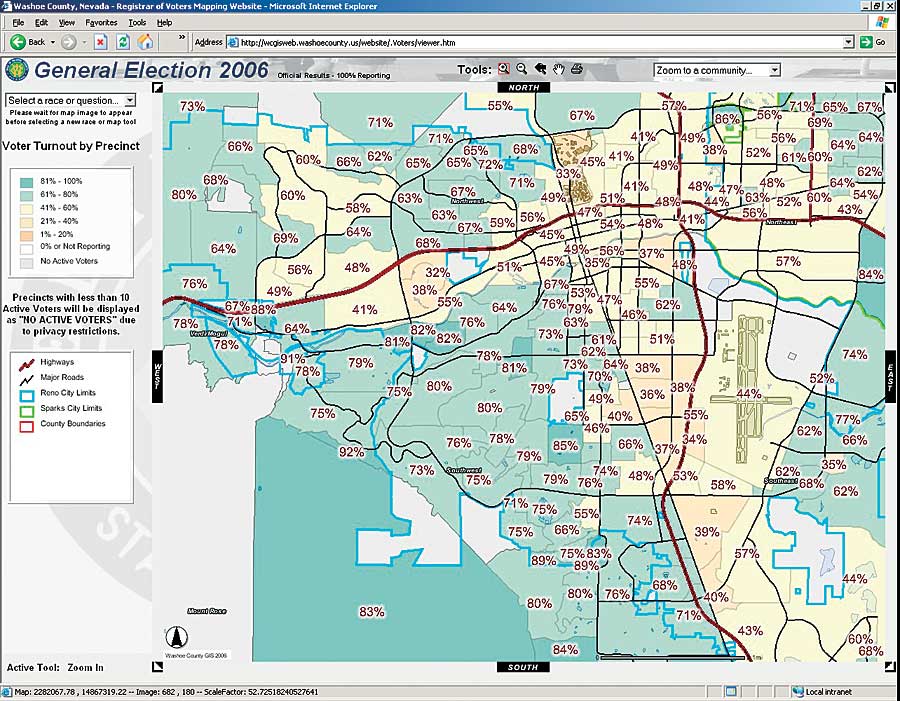
"Through ingenuity and a lot of effort, our GIS department has created a product that helps the media, political parties, candidates, and citizens," says Burk. "By tying its product to the Washoe County Web page, it has made this information readily available to all who wish to utilize it." The front end of the 2006 Live Election Mapping Web site is an ArcIMS application that uses an HTML viewer. It reads the election results stored as spatial views in ArcSDE and publishes them as an ArcIMS service. The spatial views are refreshed periodically as updates from the voting system are received. The Web interface shows a map viewer, legend, navigation tools, a drop-down list for choosing races and ballot questions, and an overall results frame showing countywide vote counts for each candidate and ballot question. The mapping application uses the election results data in SQL Server to create maps based on voter precincts stored as an ArcSDE layer. Spatial views were created in ArcSDE for each election race and ballot question by querying the results and joining them to the precincts layer. Another spatial view represented the voter turnout for each precinct. Updates occurred from 7:00 p.m. on election night until the final update just after midnight. Election results can often reveal valuable information about the election to citizens, public officials, candidates, and political parties. Citizens can see how their neighborhoods and precincts voted. The Registrar of Voters office can determine where voter turnout was high and low and compare this information with the locations of polling places. The Registrar of Voters office can also evaluate the resources devoted to each polling place to see if they are adequate.
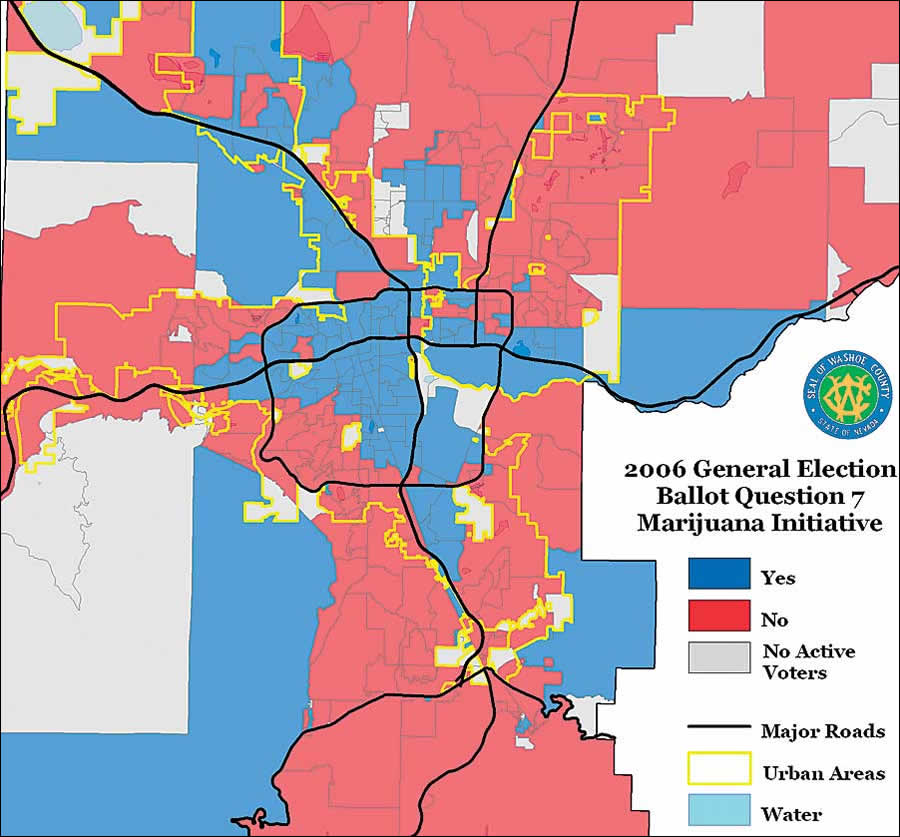
"Our GIS team members for elections have become an integral part of our service to citizens," says Singlaub. "They have helped us tremendously in our goal of making elections and the reporting of election results transparent, accurate, timely, and useful, and we couldn't do it without them. They have really gone the extra mile to make democracy meaningful to voters in our county." Election results, combined with demographic and economic information, provide valuable information to scholars and political analysts. A local newspaper used GIS data accumulated by the Live Election Mapping Web site to analyze the outcomes of several important ballot questions. It determined that while there was strong support in urban areas for a quarter-cent sales tax increase, lack of support in suburban and rural areas helped defeat the measure. It also found a similar trend defeated a statewide marijuana legalization measure, while an education initiative passed with support from both urban and suburban neighborhoods. Factors such as economics, education, race, family size, language, age, and marital status, when overlaid with election results in a spatial format, can help reveal voting patterns and behavior. This knowledge may lead to better ways of involving the public in the election process. More important, the 2006 Live Election Mapping Web site was a successful public information tool. Real-time election information generates excitement and interest and, by itself, will often draw more participation from the public. About the AuthorsKobe Harkins is a technology systems developer II and responsible for GIS support to the Registrar of Voters office. Matthew Lawton is a technology systems developer I and lead ArcIMS developer. More InformationFor more information, contact Thomas Lo, Ph.D., GIS manager, Technology Services Department—GIS Division, Washoe County, Nevada (tel.: 775-328-3614, e-mail: tlo@washoecounty.us). |