Summer 2007
Summer 2007 |
|||||||
|
|
|||||||
Esri's 2007/2012 Data Updates Provide Accurate Information for Strategic Decision Making
The U.S. Demographic Landscape Is Changing Dramatically |
|||||
|
The U.S. demographic landscape is dramatically changing—people are aging, moving, establishing households, buying second homes, and anticipating retirement. To reflect this change, Esri revised its 2007 demographic data methodologies to capture the intricacies of the changing U.S. demographic landscape and to achieve a previously unattainable level of demographic data accuracy. The Esri data development team carefully reviewed and verified all the data in the update to ensure that Esri will continue to provide the best demographic data available in the marketplace.
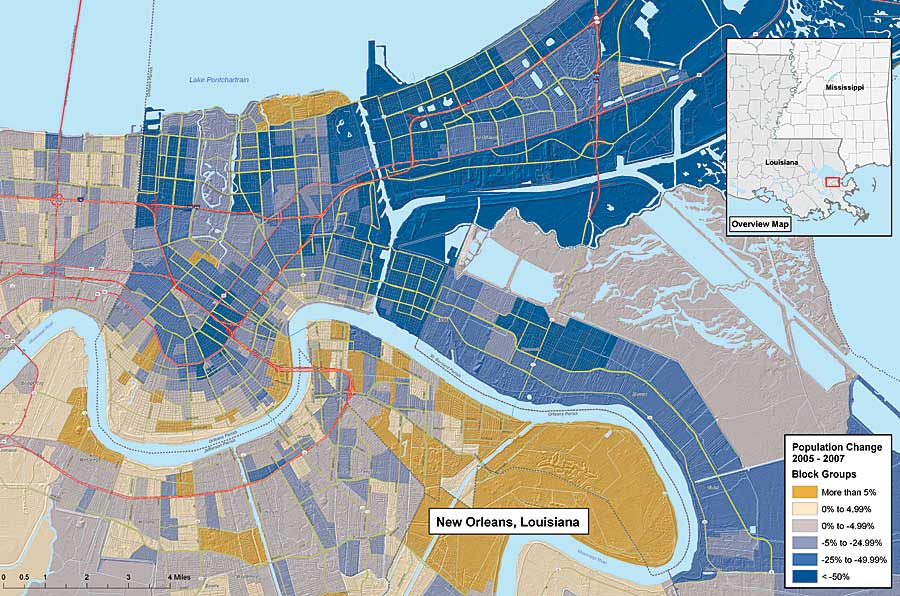
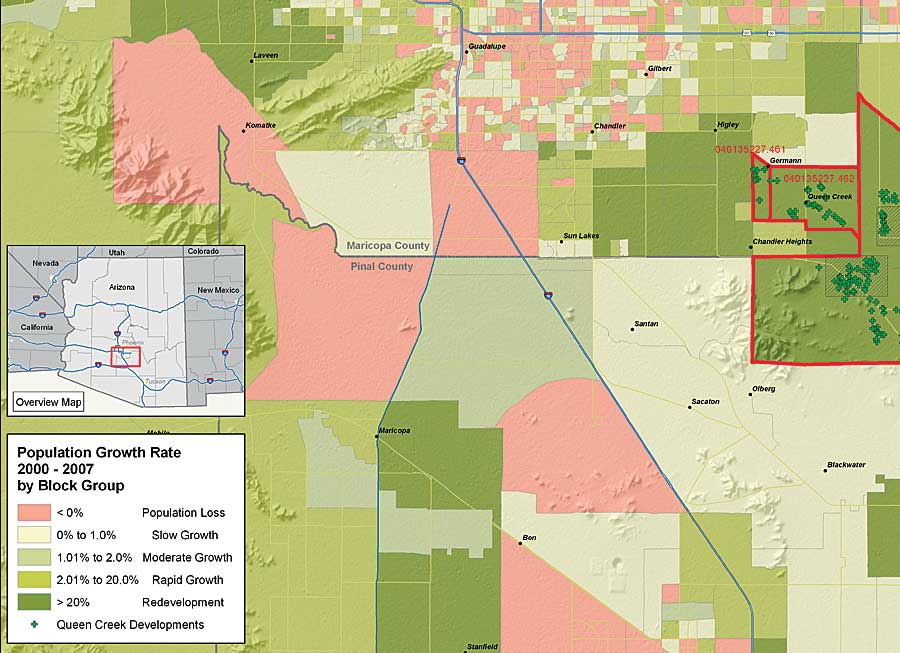
Esri's 2007/2012 demographic data updates include new developments uncovered by the combination of spatial and demographic analysis that Esri introduced in 2006. Known as Address-Based Allocation, the innovative techniques are designed to capture change in the distribution of household population. To date, these techniques have uncovered not only changes in the settlement of established neighborhoods but also in new housing in previously unpopulated areas. This year, Esri also applied these methods to the Gulf Coast communities that were impacted by the 2005 hurricane season. Building from this work and incorporating data released later in 2006, Esri was able to integrate past and current changes in the distribution and characteristics of the population along the Gulf Coast. Esri's 2007 demographic data updates reflect current events, such as rising inflation and interest rates, and regional distinctions, like the availability of jobs and affordable housing. Growth areas continue to be sprawling suburban counties near metropolitan areas that offer employment opportunities. To find affordable housing, people are moving farther away from cities and accepting longer commutes on increasingly busy roads. The U.S. demographic landscape in 2007 includes changes in housing, population diversification, household types, and median household income. Information about these changes is summarized below. HousingGone are the days of double-digit appreciation, quick sales, and rapid jumps in home value. Drastic changes in home prices from 2000 to 2007 vary by geography. Residents in metropolitan areas are benefiting from a 73 percent increase in median home values; their nonmetropolitan counterparts have achieved only a 58 percent increase. Although home value remains high nationwide, with a median of $192,300 compared to $111,800 in 2000, today's housing market faces various challenges. Inventories of new and existing homes have increased; sellers are dropping their asking prices, receiving fewer offers, and facing longer selling periods. Home builders are lowering sales forecasts, reducing staff, offering buyer incentives, and accepting higher cancellation rates. Home prices are declining in some areas, and new home sales are down. What happens now? Demographics will continue to affect housing. Both the baby boomers and Generation Y can have a significant impact on the housing market in the next decade. As baby boomers enter their retirement years, their housing needs will change. Some will downsize to smaller homes with lower maintenance, while others will seek second or vacation homes. The Generation Y cohort members are now forming new households or entering adulthood. Although still in their twenties and faced with relatively high home prices, Generation Y is an important factor in the rental housing market. As its members enter their thirties in the next few years, they will become potential homebuyers. How do these changes in the housing market affect the economy? Slightly rising interest rates coupled with rising defaults on subprime mortgages will probably cause a market correction. If the mortgage industry or Congress tightens credit lending practices, the market will certainly experience a drop in demand that can prolong or worsen the slump in the short term. However, if the volume of subprime mortgages is reduced, this action can also restore the market by bringing supply and demand back to a sustainable balance. Population DiversificationThe U.S. Diversity Index is a measure that summarizes racial and ethnic diversity. The index shows the likelihood that two persons, chosen at random from the same area, belong to different races or ethnic groups. The index ranges from 0 (no diversity) to 100 (complete diversity). The diversity index currently stands at 59, an increase of 1 percent annually since 2000.
Led primarily by Hispanic diversity, California, New Mexico, and Texas are the most diverse mainland states, with diversity indexes higher than 70. Although immigration is still rising in these states, it has a small impact on the diversity level. Traditionally nondiverse states, such as Connecticut, Maine, and Vermont, are experiencing some of the nation's highest diversification rates. The Hispanic population now stands at 46 million, or 15 percent of the total U.S. population. The influence of this ethnic group in American culture is rising, due to population growth rates of 3.7 percent per year since 2000 and a projected total of 54.7 million by 2012, approximately 17 percent of the U.S. population. Although they are smaller population groups, the Asian and non-Hispanic multiracial populations are following Hispanic trends closely, with growth rates of 3.8 percent and 3.1 percent, respectively. Household TypesThe composition of the U.S. household continues to slowly change from married-couple families to nontraditional families and single-person households. Between 1990 and 2000, the dominant share of households remained married-couple families in most states but decreased from 55 percent of all households in 1990 to 52 percent in 2000. Increased shares of single-parent and single-person units comprise the difference. Through 2007, these changes continue but even more gradually than in the 1990s. Median Household IncomeSupported by favorable labor market conditions, median household income has maintained a growth of 3.2 percent since Census 2000. Median household income for 2007 is $53,150. Driven by job opportunities and income potential, U.S. population growth in metropolitan areas is three times the growth rate in nonmetropolitan areas. Median household income in metropolitan areas is approximately $17,000 higher than the median income of $37,740 in nonmetropolitan areas. Ninety-five percent of U.S. aggregate personal income is earned in metropolitan areas. Douglas County, Colorado, continues to grow in population and prosperity. With median household income now growing at an annual rate of 5.5 percent, this area has the nation's highest county median household income, at $111,300. In the last year, other counties have passed the $100,000 mark for median household income:
With a median household income of $67,000, householders in the 45–54 age range are at the peak of their earning years and pay the highest taxes. They earn a median disposable income of $51,360 and pay 23 percent of their income in taxes. This demographic group, near the end of the baby boomers cohort, has accrued a median net worth of $155,000 and an average net worth of $625,000. Geography ChangesGeography changes must be considered as an integral part of any demographic data update. Identifying changes in areas for which data is tabulated and reported is critical to the accurate analysis of trends. In the past year, the Office of Management and Budget (OMB) made minor changes to metropolitan areas, Nielsen Media Research revised some boundaries of Designated Market Areas (DMAs), boundaries of congressional districts were changed, and ZIP Code adjustments were made by the U.S. Postal Service. Metropolitan changes include the latest revisions to core-based statistical areas (CBSAs), released in January 2007. Changes include the designation of Fredericksburg, Texas (Gillespie County), as one new micropolitan statistical area, and two micropolitan areas were revised to metropolitan areas: Palm Coast, Florida (Flagler County), and Lake Havasu City–Kingman, Arizona (Mohave County). There are now 939 CBSAs, 363 metropolitan areas, and 576 micropolitan areas. DMAs represent the 2006–2007 markets as defined by Nielsen Media Research. Most DMAs correspond to whole counties; however, there are a few exceptions where counties are split into different DMAs. More InformationInformation in this article was summarized from the white paper titled Esri Demographic Update Methodology: 2007/2012. To learn more about Esri's demographic data and the 2007/2012 demographic update methodology, visit www.esri.com/demographicdata. |