Summer 2007
Summer 2007 |
|||||||
|
|
|||||||
What Historians Want from GIS |
|||||||
|
By J. B. "Jack" Owens
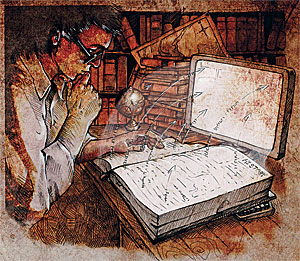
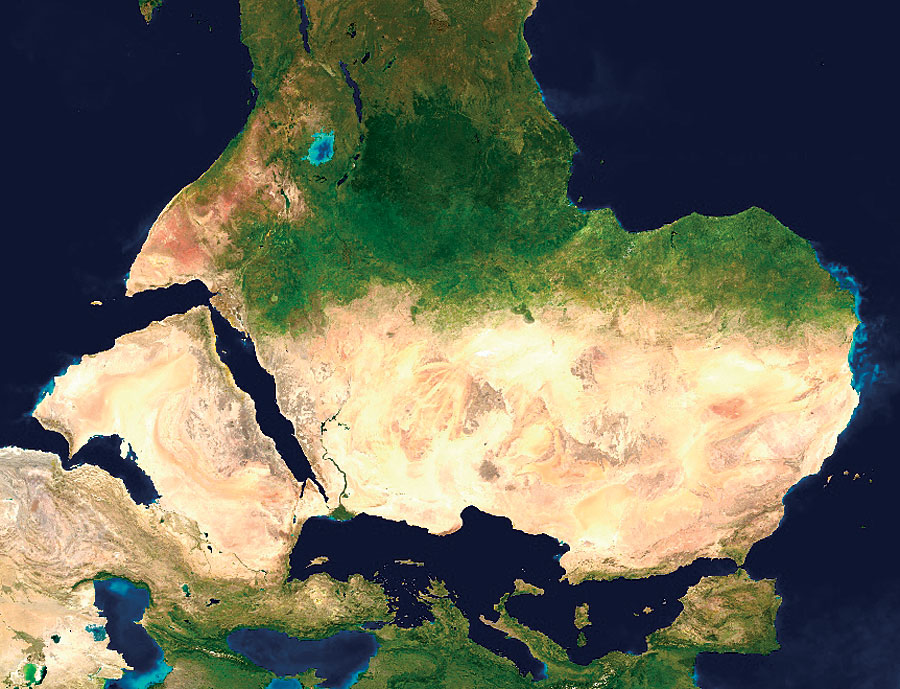
An increasing number of historians, particularly those dealing with world history or the history of large geographic regions, are becoming interested in using geographic information systems for research and teaching. Historians are noticing GIS because they normally deal with processes in complex, dynamic, nonlinear systems and, therefore, demand a means to organize a large number of variables and identify those variables most likely implicated in the stability and transformation of such systems. However, GIS remains largely unknown among the vast majority of professional historians, and a significant percentage of those who believe they know about the technology think it is something they can buy with their next car so that they will not become lost. Even those interested in some sort of geographically integrated history, a term I prefer to escape some of the limitations of the more familiar GIS history, would justifiably categorize the title of this article as pretentious. GIS and HistoryI am often the only historian at geographic information science (GIScience) meetings, and my presence provokes the obvious question. A story will explain why a historian would become interested in GIS. At the beginning of my graduate studies, I read Fernand Braudel's La M�diterranee et le monde m�diterran�en a l'�poque de Philippe II because I was studying the western Mediterranean in the 16th century and plunged into this 1949 book with considerable enthusiasm despite its imposing length. As I read Braudel's attempt to integrate the slow changes in the Mediterranean's geographic form, climate, flora, and fauna with the faster alterations in human socioeconomic relations and the specific wars, political alterations, and other events of the 16th century, I struggled to understand how these different layers of the account, which were discussed in sections characterized by the variable speeds of temporal process, fit together. At the time, I tried tracing maps of human cultural features, such as cities and centers of economic activity, over topographic maps in an effort to integrate better the elements of Braudel's history. This work produced nothing more than a visual mess, which also failed to capture the considerable dynamism of Braudel's account. Moreover, I repeatedly felt frustrated that I could not easily examine particularly interesting segments of my visualizations at a larger scale.
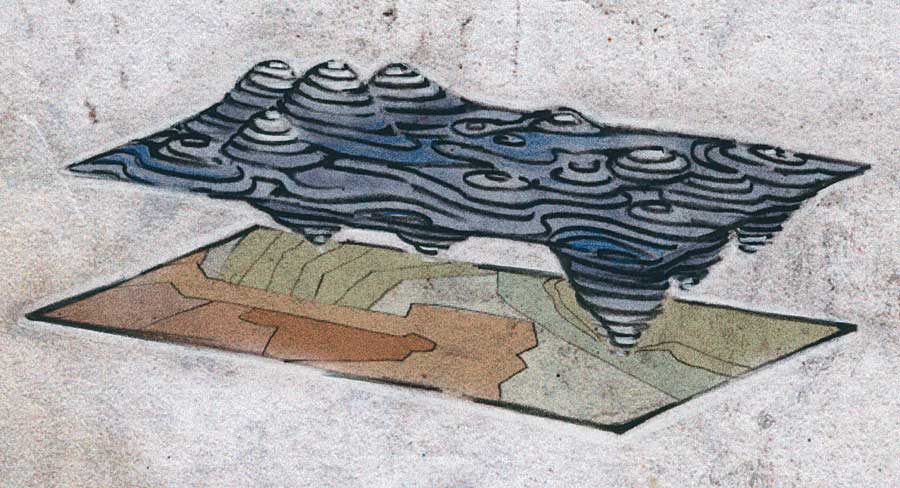
Many years later, on a hot, sleepless night in Murcia, Spain, in 1983, I used my daughters' tracing paper and colored pencils to try this technique again. This time, I was investigating the development of a cohesive oligarchy in southeastern Castile and wanted to see, literally, how my different types of data went together. I was particularly interested in the evolution of social networks among individuals, families, and communities within a regional social and cultural environment. Alas, even for this more spatially restricted story, no useful result emerged from the tracings that captured the dynamism and complexity of the processes involved. Again, after the passage of many years, when I told this story during an online discussion of possible titles for Andre Gunder Frank's 1998 book ReORIENT: Global Economy in the Asian Age, I learned from other participants, Martin Lewis and K�ren Wigen, that a method existed to undertake the type of visualization I had earlier attempted. They recommended that I try GIS as an integration and visualization tool, and I participated in my first GIS workshops with great aesthetic and intellectual satisfaction. It so happens that Frank's book, which focuses on the first global age, 1400–1800 CE, formed part of a body of work produced by Braudel, Immanuel Wallerstein, and others on historic "world systems," which were geospatially large, interconnected, dynamic entities of considerable complexity. Although Frank rejected existing linear, civilizationalist, and Eurocentric social science theories of historical development, as well as his own pioneering work in economics on dependency theory, he admitted that he did not know how to undertake the type of data organization and analysis that would be necessary to understand such complex systems. He, therefore, limited his book to a path-breaking discussion of the world economy, for which he received the inaugural Best Book prize of the World History Association in 1999. Since early 1995, Frank had been pushing me to figure out how such a comprehensive "holistic global analysis" (his phrase) could be done. It increasingly appeared to me that GIS, with its capacity for the aggregation of data on the basis of geographic location and spatial analysis, provided a tool for the work that Frank had wanted to do before he died in April 2005. GIS and Disciplinary CrisisIt is difficult to convey to readers of a written text a complex, multidimensional history, even a linear one. Because such a high percentage of the human brain becomes engaged by visual tasks, visualization must be a component of any account of this type of historical system, and with its tie to cartographic forms of representation, GIS visualizations can play a particularly valuable role in increasing the understanding of geographically vast subjects like the histories of major world regions or of the world itself. For this reason, GIS offers great promise as a means to develop high-quality classroom materials for history teaching. Therefore, beyond its integration, visualization, and analytical potential, I began to look on GIS as the central piece of a response to the serious and worsening crisis in which the discipline of history had been enmeshed throughout my teaching career. Through a failure to adapt, history surrendered its place in a curriculum designed by Renaissance educators to prepare students for humanitas, effective leadership. For 35 years, the discipline has suffered from a tight higher education job market, the relatively low position of history departments in the development plans of most colleges and universities, a lack of appreciation by university administrators for the discipline's traditional publication emphasis on the individually authored monograph, and the growing weakness and instability of history in K–12 curricula. Over the past decade or more, the disciplinary crisis has become dangerous because leaders of four-year and graduate institutions have confronted a rapidly changing U.S. higher education environment. Levels of federal and state support have fallen, and public and private institutions recognize limits on tuition increases to cover budget shortfalls. Higher education cannot easily reduce expenditures because students must be prepared to deal with constantly shifting, globalized environments whose developments are driven by rapid changes in communications and information management. The discipline will either contribute to the painful readjustment of U.S. higher education that is currently under way, or history departments will decline further in terms of resources and internal administrative influence within their respective institutions. In the midst of some institutional crises, existing history departments may disappear as the remaining history courses will be housed within other units, such as education, which will undermine the discipline's contributions to critical, research-oriented thought. It does not take much imagination to envision education programs, without coherent history departments, organized to produce teachers of the sort of uncritical, "patriotic" K–12 history curriculum advocated in the 1990s by some opponents of the national standards for U.S. and world history. What solution does the use of GIS offer? Collaboration and GISLeaders of the discipline of history have long resisted collaborative forms of research, and they have been slow to adopt contemporary communications and information management technologies. Working alone, historians frequently extract data from sources that are difficult and time-consuming to discover and use, and thus, their research usually has a relatively narrow geographic and temporal focus. As one result, synthetic studies of cultural, institutional, and economic evolution over long historical periods often badly distort reality because this type of work has frequently been left to scholars from other disciplines who are largely unfamiliar with the nature, limitations, and uncertainty of the poorly structured, fragmented, messy data used by historians in their individual research. The failure to transform research practices and graduate training has crippled the ability of historians to respond effectively to major problems in world history and increasingly marginalized the discipline at major research universities. GIS offers historians who specialize in the histories of different places and chronological periods an effective vehicle for collaborative research among themselves and for involving researchers from other disciplines. At any point in its work, a research team can visualize its available data and decide what additional information is required. Such research will often produce and be based on digital, shared databases, archived in public, online repositories, which will constitute a body of knowledge capable of expansion and the correction of errors. The cumulative results will allow us to better address the complexity of history by melding diverse voices and stories and a wide variety of sources. This capacity for collaborative work will enable historians to join research teams able to submit more ambitious proposals to a greater variety of funding sources and will lead to jointly authored papers addressing a broader range of problems and readers. By escaping their self-imposed disciplinary isolation, historians will enhance an already dynamic discipline at the same time they will make themselves an important part of the solutions to institutional budget difficulties. The Future of History at ISUIn response to these many factors, and to produce leaders for this exciting future for historical research and teaching, the History Department of Idaho State University (ISU) developed a new internship- and GIS-based master's degree program in geographically integrated history, known officially as the M.A. in Historical Resources Management (MHRM). This appears to be the first history program of its kind in the world (see the Fall 2005 ArcNews article on the program, "Idaho State University Creates Innovative Program in History and GIS"), and it is one of the fundamental building blocks of ISU's proposed interdisciplinary Ph.D. in social dynamics and human biocomplexity. These developments are supported by ISU's GIS Center. Because the university has never had a geography department, the center's director reports directly to the vice president for research, and its oversight committee has representatives from all interested academic units, including the History Department.
During the process of creating the master's degree program, we transformed our undergraduate history curriculum to give it a distinctly geospatial focus. For example, we may be the only history department to state as a core objective that students will understand cartographic design and maps as historic sources. With the kind assistance of Waldo Tobler, I introduced a course on this subject to history undergraduates in the fall of 2006. Although the first students only began their master's studies in August 2007, the program has already permitted the department to submit major multiyear funding proposals to support our own research and the educations of the master's students and participating undergraduates. We have under consideration a proposal for an ambitious multidisciplinary, comparative study of the impact of public policy on rangeland health in 20th-century Idaho, Mongolia, and Spain, and we are in the preliminary proposal stage of a project to develop GIS-based support for the high school U.S. history standards and to train public school teachers for this type of teaching. We are also part of a campus group that is preparing a funding proposal for a temporal GIS. The National Science Foundation (NSF) has provided $394,000 to support for three years my participation and that of my graduate research assistants in a large GIS-based, multinational, multidisciplinary, collaborative research project entitled Dynamic Complexity of Cooperation-Based Self-Organizing Commercial Networks in the First Global Age (DynCoopNet). I designed DynCoopNet to address a program of the European Science Foundation's (ESF) European Collaborative Research (EUROCORES) Scheme, The Evolution of Cooperation and Trading (TECT), which was devised by evolutionary biologists and economists. The DynCoopNet collaborative research community investigates the evolution of cooperation among merchants and between merchants and other groups, with particular attention to the commercial networks of importance to the global domains of Iberian monarchies, 1400–1800 CE. In addition to the NSF support, I also receive generous travel support from EUROCORES, and I was named to the Scientific Committee, which will guide the entire TECT program. After years of administrative neglect and failure to provide the History Department with necessary resources in the face of greatly increased enrollments, our GIS activity has drawn significant attention from ISU's administration. As one direct consequence, my department received approval to hire Sarah Hinman for a new position. She is a recent Ph.D. (of Louisiana State University's Geography Department) who uses GIS to study historic public health problems of U.S. cities. She will provide us with significant support as we strengthen our research and teaching programs. To help us maintain our momentum, we have reason to hope that we will soon be permitted to hire a historian of modern Europe with a strong programming and GIS background and to receive support for the graduate GIS teaching laboratory and classroom we have designed. Challenges for GISAs exciting as these new triumphs and opportunities are, we nonetheless recognize that there is much more to do to adapt GIS to a discipline, such as history, for which time is significant. I prefer to describe what we advocate as geographically integrated history because we cannot be locked into the questions and analytical techniques dictated by the available GIS software. Yes, of course, there are applications and combinations of applications that will take us partway down the required paths of dynamic history. To make further progress, though, it is clear that historians must concentrate on developing, in collaboration with other disciplines, process models that capture the importance of geospatial relationships and variations. Because of the importance of time to their discipline, historians especially require a spatial-temporal GIS built on the basis of mathematical models that will permit an evaluation of the fit between data and theory, compensate for gaps in the data or missing data types, and facilitate the analysis of the emergence of new forms in complex systems and of object/field dynamics, such as the diffusion of innovations. These models must be appropriate for dealing with complex, dynamic, nonlinear systems, which are probably a great deal more common than simple, linear ones, and with the geospatial aspects of these systems. The existing forms of GIS visualization usually involve some sort of cartographic representation, and these lend themselves well to presenting research results, engaging the public in discussions, and teaching. A spatial-temporal GIS should also provide effective means of visualizing the dynamics of complex systems because the visualizations produced by the mathematical expressions used to model nonlinear dynamics, while often aesthetically pleasing, are too difficult to grasp for policy makers or other audiences whose mathematical skills do not extend to partial differential equations. In economics, both these concerns, nonlinear dynamics and geographic space, have been marginalized in recent decades in preference for simpler, linear economic models, which offer the illusion of confident predictability without reference to geospatial variations. As a consequence, around 1990, leaders in the field were predicting the universal benefits of a globalized economy from which all the planet's inhabitants would enjoy increased well-being. Many of them have begun to recognize the error in their prediction. If they had used nonlinear, spatial models, they would have warned policy makers that pushing locally stable economies into a world one would likely produce local chaos, resulting in environmental degradation, famine, disease epidemics, wars, and other forms of terrible human suffering with planetary impacts. But at least a number of useful spatial models already exist in economics, and major figures continue to develop these, such as Swedish economist T�nu Puu of Ume� University's Centre for Regional Science. GIS Research OpportunitiesBecause other social sciences, especially political science and sociology, have remained more faithful to the 19th-century linear theories around which they were developed, the number of available, useful models, which can be expressed in mathematical terms, is much more limited. However, there are researchers working to develop such models, such as Michael Sonis of the Geography Department of Bar-Ilan University in Israel. He is writing a book on the diffusion of innovations for which he models sociological theories to account for the diffusion of ideological innovations producing "aggressive intolerance." A great many exciting research possibilities are open to historians interested in the nonlinear dynamics of human ecology, social organization, and political institutions and the interpretive schemes of the cultural environment to create such models and to GIScientists interested in integrating such process models into GIS. Moreover, except to assert the supremacy of a European pattern of development as the model for understanding and "modernization," these 19th-century social science theories and their 20th-century descendants largely ignored geographic differences and spatial questions, which means that there is much that geographers can do to expand the horizons of the social sciences. Because of humans' weak cognitive capacity to grasp spatial relationships, it is helpful to historians to make "snapshots" of their data at various intervals in the historic chronology, as we do now, but more must be done if GIS is to fulfill its promise for historical research and teaching. Historians require distinctly temporal forms of GIS and must collaborate with experts in GIScience and mathematical modeling. The DynCoopNet project of TECT is addressing these issues. Getting What Historians WantIn his book ReORIENT, Frank argues that the history of no place can be adequately understood without integrating into the analysis environmental, economic, political-social, and cultural information about it or taking into account how that place has been connected to other places. All locations were parts of geospatially large systems, which, after the 15th century CE, constituted a single world system whose dynamics continuously shaped what happened in these places, while at the same time local developments influenced systemic processes. In 2000, the authors of the Organization of American Historians' LaPietra Report (www.oah.org/activities/lapietra/final.html) emphasized that, for reasons similar to Frank's, you cannot make sense of U.S. history without taking into account the ways in which the country has been linked to other places in the world and the changes in the pattern of those interactions over time. In fact, because for thousands of years most of the world's people have been connected throughout large geographic regions, the history of any place, including large countries, can only be understood by grasping how that history has been shaped by the way the place has been connected to other places. Since the 15th century and the development of some sort of truly global, dynamic, nonlinear system, the histories of the places within the system have been shaped by the nature of the system and the way they have been linked to it. The common practice of writing and teaching history on the basis of the political boundaries of modern countries is antithetical to such a connected history, and it will be necessary to conceptualize geographic regions on the basis of additional variables. Because the spatially large systems have undergone systemic transformations, which fundamentally alter human cultural perceptions and values, models for understanding process within one historic system, even ours, may not be easily adaptable to others. Therefore, to create a GIS for data organization and visualization that is fully useful for historical research and teaching, many new models will be required, and this demand should stimulate research capable of profoundly changing a number of academic disciplines. In exploring the evolution of cooperation-based commercial networks in the first global age, which requires understanding the pattern or form of these networked interactions and the processes of a dynamic, nonlinear world system, the DynCoopNet project will create the spatial-temporal GIS to implant GIS as a significant component of historical research and teaching. About the AuthorJ. B. "Jack" Owens is professor of history at Idaho State University. He is the cocreator of ISU's GIS-based master's program in geographically integrated history, the M.A. in Historical Resources Management. The U.S. National Science Foundation has funded his work on the DynCoopNet project for three years. Owens' understanding of complexity, nonlinear dynamics, and temporal GIS has been shaped by reading papers by the computer scientists, economists, geographers, and mathematicians of the DynCoopNet research team, including professors Puu and Sonis (identified above) and professors Monica Wachowicz and May Yuan, and he wishes to thank them for their patience in responding to his endless questions about their work. More InformationFor additional information, contact J. B. "Jack" Owens, History Department, Idaho State University (e-mail: owenjack@isu.edu). |