Summer 2008
Summer 2008 |
|||||||
|
|
|||||||
California Postearthquake Information Clearinghouse Rocks |
|||||
Highlights
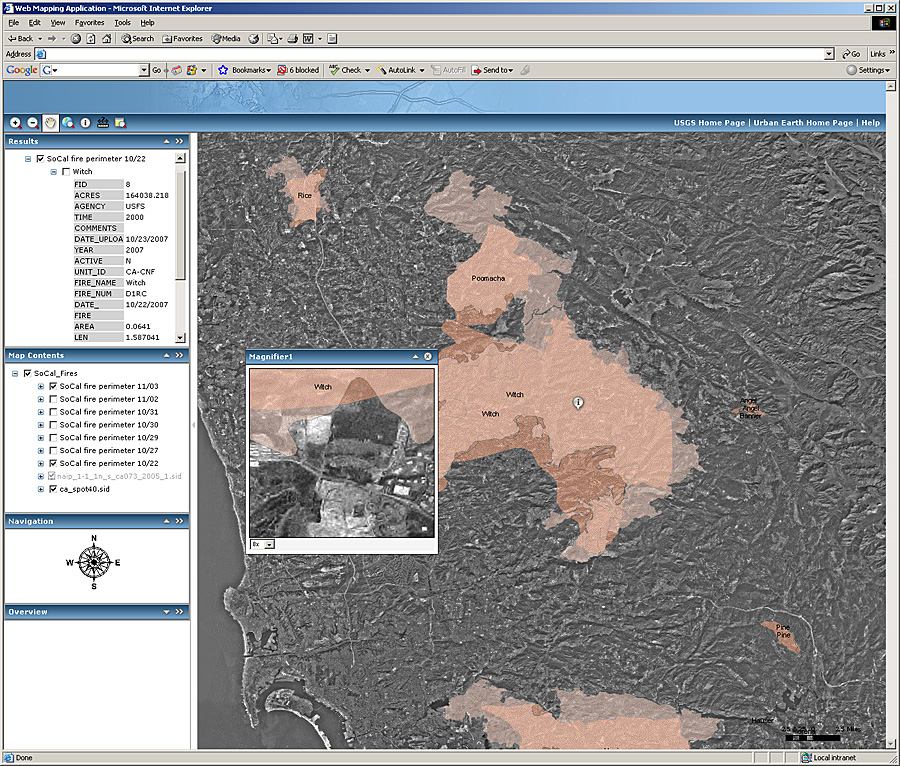
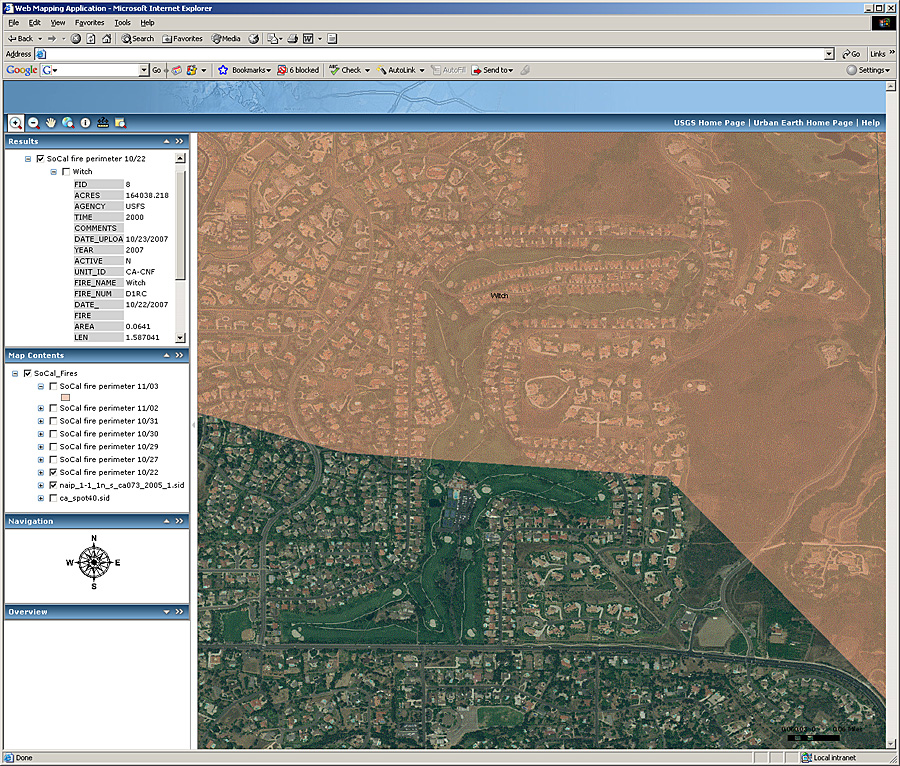
The California Information Clearinghouse was formally established in a directive signed by governor Ronald Reagan following the magnitude 6.5 San Fernando earthquake in 1971. The purpose of the clearinghouse is to systematize the collection of critical, often ephemeral, data from field investigations to promote its use by emergency managers during the response and recovery phases following damaging earthquakes and to archive this data for use by researchers in producing a more methodical analysis of earthquakes and their impacts.
The clearinghouse has grown to include more than a dozen federal, state, academic, and nongovernmental organizations, though management falls to just four: the California Geological Survey (CGS), California Office of Emergency Services (OES), Earthquake Engineering Research Institute (EERI), and U.S. Geological Survey (USGS). While the clearinghouse concept has been implemented during other disasters, such as 9/11 and Hurricane Katrina, the California Information Clearinghouse itself remains focused on earthquakes. GIS has long had an important role in the clearinghouse as a way to integrate the variety of field data collected by geologists and engineers. Following the magnitude 6.7 Northridge earthquake in 1994, OES supported a mobile GIS lab that ran 24/7, which allowed each day's data to be incorporated overnight into maps that were available to researchers to guide the next day's fieldwork. The clearinghouse was colocated with the Regional Emergency Operations Center (REOC), which simplified sharing the results of these investigations with emergency responders. In recent years, the advent of mobile GIS has dramatically improved the way the field scientists gather and share postearthquake information. In the past, geologists from USGS and CGS gathered such information in three different paper forms. A liquefaction form was used to gather data about how the soil behaved during strong shaking, noting any evidence of liquefaction, such as sunken structures or sand volcanoes. Another form was used to describe earthquake-induced landslides. A third form recorded geologic parameters of ground ruptures, such as how much offset occurred along the fault, the angles of fault movement, and any secondary cracks or movements that occurred away from the fault. If a GPS unit was available, the location coordinates could also be written down on the form. Otherwise, a dot on a topographic map became the location for these observations. Incorporating this data into a GIS usually required the help of a GIS specialist and a delay of hours or days. Now geologists from both USGS and CGS can enter the same field data into a GIS running on a handheld device, using an attached GPS to automatically provide location coordinates. Luke Blair of USGS, a longtime user of Esri GIS software, designed the mobile versions of the three forms. Each is written as simply as possible so that someone who has never used GIS can easily record information. The user can toggle between the three types of forms depending on the situation. Every data entry into ArcPad instantly has a GPS latitude and longitude point attached to it. When the digital data is uploaded at the office, it can be immediately input into the geodatabase for the event and processed in GIS. The clearinghouse GIS worker is then able to quickly produce an online map. "We are looking to step into the new generation of technology with ArcGIS Server," says Blair. "Ultimately, this would make it possible for data to be wirelessly sent live from the field for map production and analysis for both scientists and first responders." USGS Multi-Hazards Program
Scientists at the USGS Multi-Hazards program in southern California recently created a 3D projection of the San Andreas Fault. This virtual reality tool is used to visualize and assess the infrastructure and geologic weaknesses in important Southern California lifelines using GIS mapping projections. The model shows the vulnerability of human infrastructure to a major earthquake along the southern area of the fault, the consequences of landslides on slopes, and the abundance of clean drinking water. The USGS Multi-Hazards program maintains data from a wide range of high-risk areas around the world, extending from the bathymetric depths of deep-sea trenches to the heights of mountainous digital elevation models. Because of the huge volume of data, it can be challenging for clients to grab the exact data they need. ArcGIS Server comes to the aid of solving this problem because it is fundamentally an object server that manages a set of GIS server objects, which make up the foundation of GIS products. Robert Lugo, a USGS physical scientist working for the USGS Multi-Hazards program in California, has put this technology to work in designing a query application, making data searches faster. Lugo explains, "The upgrade to ArcGIS Server has made application design much faster. It can quickly access data. In addition, I can use the ArcCatalog application within ArcGIS Desktop to create object containers that are useful because at the same time I am browsing through data on the server, I can create the object container. This really streamlines the process. For example, I can browse through datasets of rivers, floodplains, and drainage basins, bring the data I want into a server object container, and quickly create a map service by using the ArcMap application within ArcGIS Desktop to create a map document and publish it using ArcCatalog. In ArcGIS Server, I can open a handy wizard to design a Web application for a Web page that displays the map and provides the specific functions the user will need to interact with that data." On other fronts, USGS scientists are using ArcGIS ModelBuilder to design process flows for different types of hazards. These models process data using specific processing rules to create the needed map. It then serves the map on the clearinghouse Web site so that clients can access and use it. During a disaster, demand for map services is high, and data and imagery files can be quite dense. USGS has a robust network that supports this kind of traffic. Access is restricted to specified emergency clients so that the network remains operable during emergency events. More InformationFor more information, contact J. Luke Blair, GIS manager, USGS Earthquake Hazards Team, (tel.: 650-329-4707, e-mail: lblair@usgs.gov), or Robert Lugo, physical scientist, USGS (e-mail: rlugo@usgs.gov). |