Summer 2009
Summer 2009 |
|||||||
|
|
|||||||
City of Davenport Uses 3D Visualization to Prepare for Flooding |
|||||
|
By Dave Cox and Kevin James, City of Davenport, Iowa The city of Davenport, Iowa, has a long history of flooding. In the last 33 years, there have been eight major Mississippi River floods that have affected the city. In the early 1980s, Davenport decided to use passive flood protection instead of building permanent flood walls or levees to protect the downtown area. This passive protection plan consists of temporary earthen levees, sandbag walls, pumps, and a series of gates to close storm sewer pipes. To efficiently and effectively complete these tasks before floodwater reaches downtown, the city has developed a detailed flood plan consisting of written procedures and maps for various flood levels.
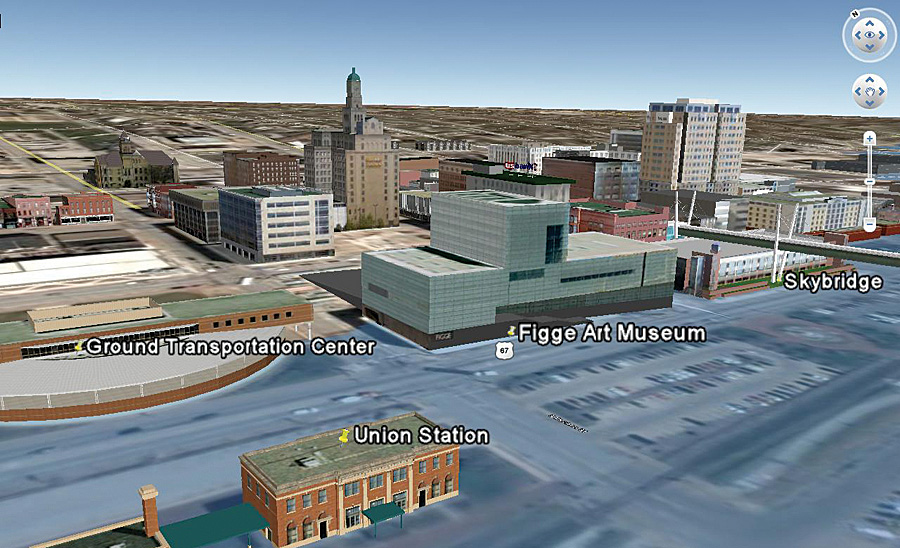
During the winter of 2007�2008, large amounts of snowfall threatened the city with potential flooding in the spring. This risk prompted the public works director to ask GIS personnel to create a demonstration of Davenport's current flood plan for the city council. GIS staff reviewed the maps in the plan and decided that they could use ArcGIS to create a 3D model that would be a more effective way to convey the different aspects of the plan. They used the ArcGIS 3D Analyst extension's ArcScene application to create a 3D model that showed which parts of the city would be inundated at various flood stages. This model made it possible for city staff and council to visualize data about how floodwater could affect specific parts of the city at any flood stage. Prior to GIS, Davenport's flood models took a long time to complete. Staff would print contour maps, then draw red lines on these maps to show where the predicted floodwater levels would reach. Multiple calculations were made to account for the slope of the Mississippi River. Now, GIS provides analysts with the tools to build a 3D model based on information the city already had, such as two-foot contour data, building footprints, storm utility data, street centerlines, and aerial photography.
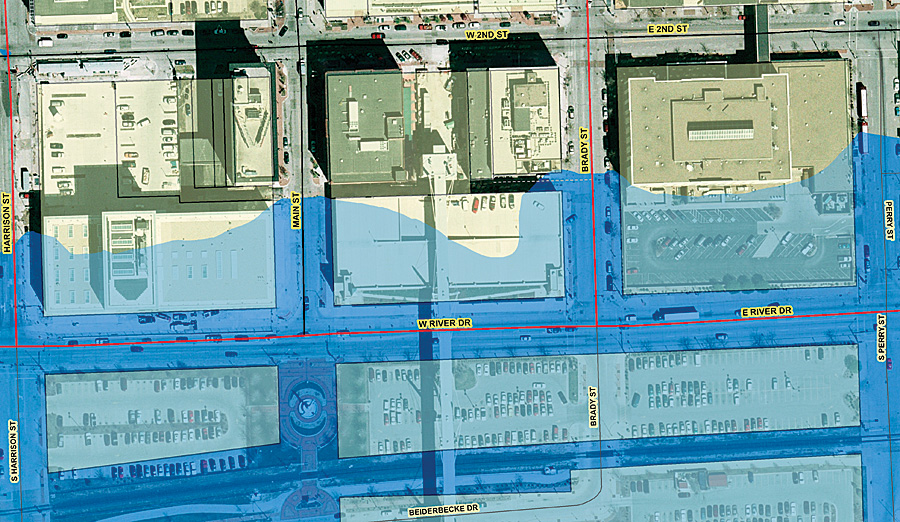
Adding GIS to the workflow for modeling Mississippi River flooding supports a logical progression and produces insightful results. The first step is to create two surface triangulated irregular networks (TINs) using the 3D tool in ArcGIS Spatial Analyst. One TIN represents the actual ground level. It is created using the city's existing two-foot contour data. Another TIN represents the river rise, calculated using river slope data from previous floods, which was collected by Davenport's engineering/survey division. In the second step, the river TIN's elevation is set to flood stage zero as a starting point for modeling. In the third step, using ArcScene, analysts offset the base height of the river TIN to various flood stages, then display areas of the city where flooding would or would not occur. The fourth step is to verify the GIS model's accuracy by comparing its outcomes with paper maps and written documentation from previous years. In the fifth step, analysts add the locations of levees, pumps, and gates to the model, so areas that would be protected by this infrastructure are shown in the visualization. About the AuthorsDave Cox is the GIS specialist for the City of Davenport's Public Works Department. He has more than three years of experience working with infrastructure data, creating 3D models, and providing detailed GIS analysis. Kevin James is the GIS coordinator for the City of Davenport and manages the various GIS services provided to internal employees and the public. More InformationFor more information, contact Dave Cox, GIS specialist, City of Davenport (e-mail: dac@ci.davenport.ia.us). |