Summer 2009
Summer 2009 |
|||||||
|
|
|||||||
The U.S. Population Is Aging, Changing, and Struggling
Trends from Esri's 2009/2014 Updated Demographics |
|||||
Highlights
Recently updated by Esri's data development team, the 2009/2014 demographic updates and projections were produced with proven methodologies to provide the highest possible level of accuracy. In the past year, changes in the nation's economy have become extremely personal. The failure of the subprime mortgage market in 2007 extended its devastating impact in 2008, shaking the very foundations of the U.S. economy and touching every household in the country. Nearly everyone in the United States has been directly affected or knows someone who has been impacted by life-changing events such as job loss, home foreclosure, reduced retirement savings, and lower home values. As ArcNews goes to press, the economy remains in recession. Esri's 2009 Updated Demographics reveal some of the key changes. Housing Market
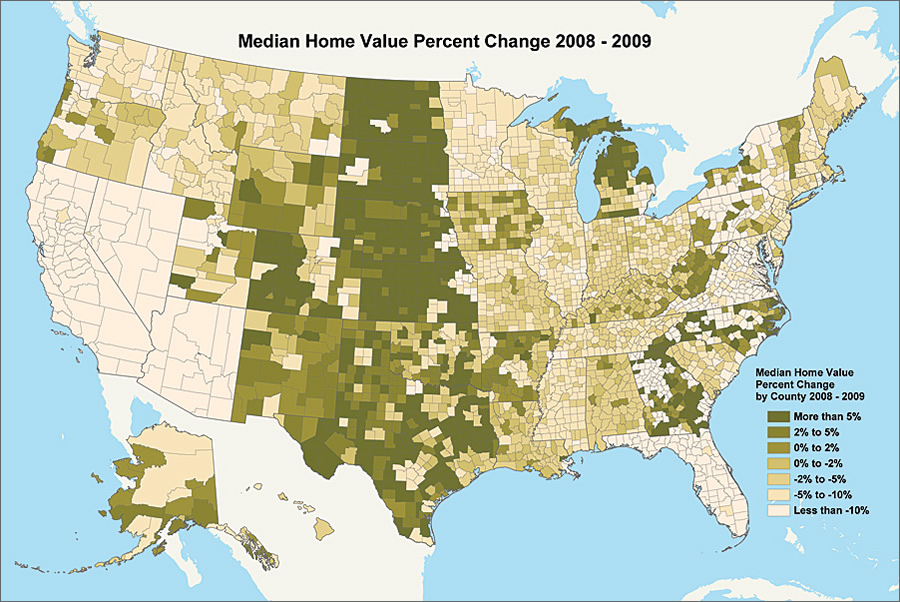
The continuing slump in the housing market is now being affected by the economic downturn. Foreclosures rose 81 percent in 2008, with sharp increases since January 2009. Part of this foreclosure increase may be attributed to mortgage holders' inability to make payments because of job losses. The 2009 median home value is $162,000, 11.3 percent lower than the 2008 figure. The decline in the 2008�2009 median home value has affected more than two-thirds of U.S. counties. Vacant housing units increased by more than 8 percent; the U.S. vacancy rate is now 11.2 percent. The 2009 homeownership rate of 66.2 percent is now slightly less than the rate in 2000. Economic TrendsAccording to the National Bureau of Economic Research, the economy has been in recession since December 2007. The committee determined that the decline in economic activity in 2008 met the standard for a recession. Without seasonal adjustments, the unemployment rate rose to 10.6 percent. In the past year, 5.6 million jobs were lost. The economy continues to slow because of job losses, the drop in housing prices, lack of consumer confidence, and the credit crunch. Income
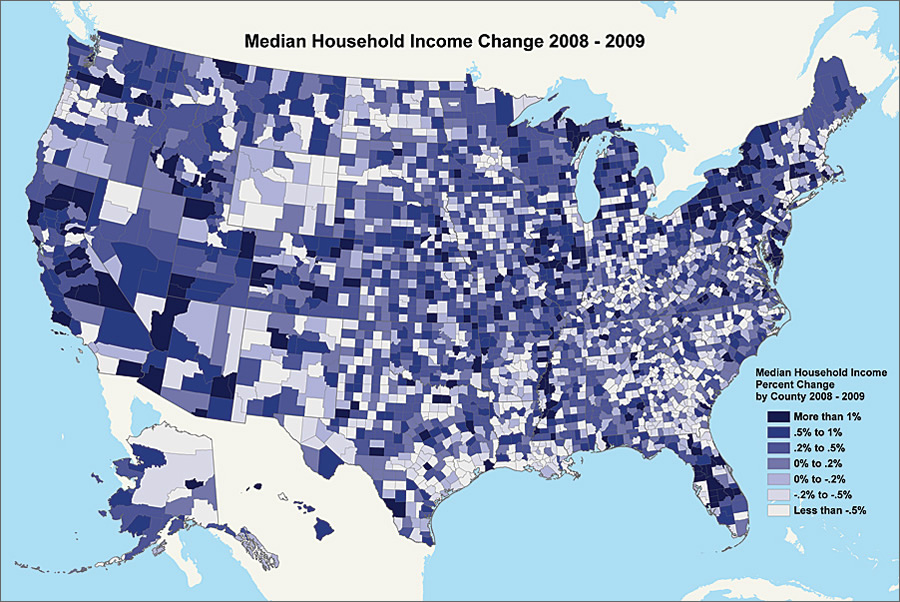
Median household income did not grow in 2008. The U.S. median household income figure stands at $54,700. Thirty-seven percent of U.S. counties are experiencing declines in median household income. This decline will directly affect local consumer buying power, resulting in lower sales tax revenues for area governments. Median net worth declined by 7.6 percent to less than $98,000. PopulationIn most markets, population growth and change slowed pervasively due to decreased in- and out-migration flows. The job market has not yet offered significant employment opportunities for movement, as the sluggish housing market has prevented people from moving to more productive regions. The fastest-growing areas from 2000 to 2009 are counties that are adjacent to large metropolitan areas:
Fastest-growing ZIP Codes are
Whether we like it or not, we're all aging. The U.S. median age in 2009 is 36.9 years, an increase of 1.5 years since 2000. Population DiversityThe "face" of America continues to change as more people arrive in the United States to seek the American Dream, or are born to those of various races and ethnicities. The most diverse states are California, New Mexico, and Texas, due in large part to the growth of the Hispanic population. The 2009 Hispanic population is 48.7 million or 15.7 percent of the U.S. population. From 2000 to 2009, this population segment has grown more than 3.5 percent annually. The Asian population in 2009 is 13.9 million or 4.5 percent of the U.S. population. Since 2000, this population has grown at a rate of 3.4 percent annually. The multiracial population is now 9.1 million, approximately 3 percent of the total U.S. population. The annual growth of this population segment is 3.2 percent. Esri's 2009/2014 Updated DemographicsDelivered in a wide range of geographies, formats, and variables, Esri's Updated Demographics will also be available in ArcGIS Business Analyst Online, ArcGIS Business Analyst (desktop), ArcGIS Business Analyst Server, ArcGIS Online, and Address Coder and as ad hoc data. More InformationFor more information, visit www.esri.com/demographicdata. See also "Esri's Updated Demographics." |