Summer 2010
Summer 2010 |
|||||||
|
|
|||||||
ArcGIS Online Services Combine Basemaps, Imagery, Real-Time Data
Manitoba Responds to Red River Flood with Common Operating Picture |
|||||
Highlights
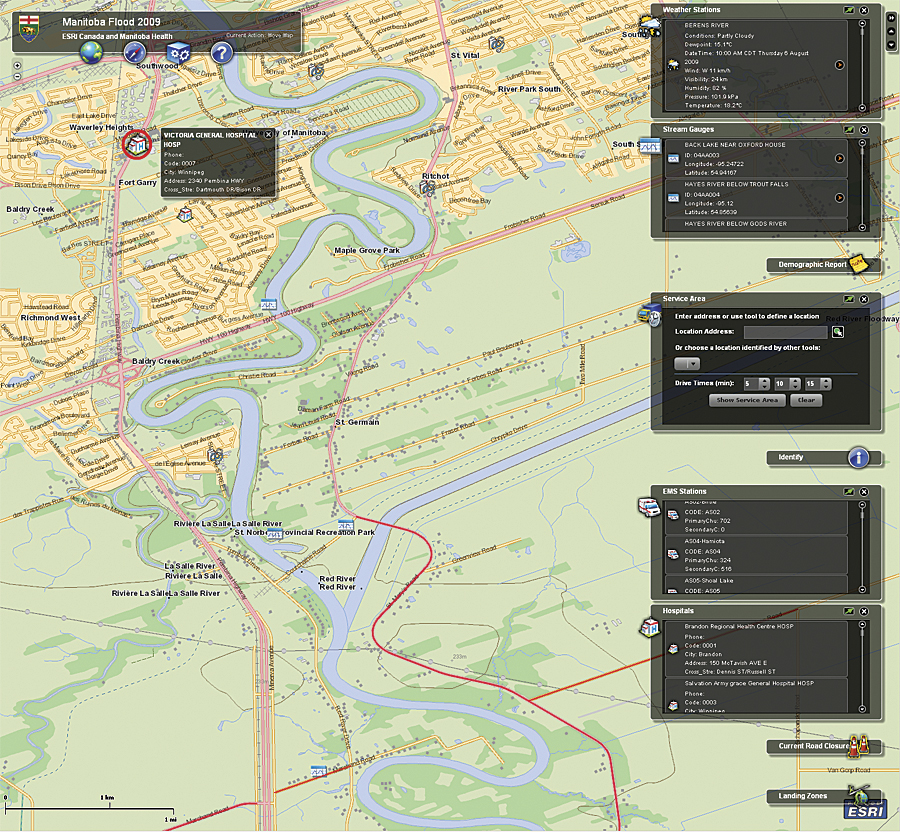
With crests rising to more than 20 feet, the spring 2009 Red River flood surpassed the floods of 1950 and 1979 to become Manitoba, Canada's second highest since record keeping began in the 1800s. The situation was exacerbated by seasonal snowmelt, powerful ice jams, flash flooding across the province, and heavy rainfall. In response, Manitoba Health's Office of Disaster Management (ODM) funded the development of a common operating picture (COP)—an effective visualization tool that enabled the province to achieve real-time situational awareness, act quickly, and communicate its response plan to key stakeholders.
During the flood, ODM was tasked with ensuring the continuity of health services for community residents and that emergency operations remained uninterrupted. To meet these challenges, ODM needed a tool that would allow it to analyze the current situation, predict future outcomes, and make critical decisions—such as deciding which roads to open and close, which residences and buildings to prioritize for evacuation, and which routes were most effective for emergency vehicles to travel. It also needed to communicate these decisions quickly and effectively to senior decision makers to enable them to take action and mitigate risk to residents. With few resources available to implement a complex system, the situational awareness tool would have to be simple, intuitive, and able to guide users through the four stages of emergency management—mitigation, preparedness, response, and recovery. ODM sought a partner to help develop the tool and selected the expertise of Esri Canada Limited, Esri's distributor in Canada. Together, they built the common operating picture with ArcGIS online services to combine basemaps, imagery, and real-time data into a map window, so that ODM could achieve an accurate visual of this unfolding natural disaster. The data sources included satellite imagery, data from CanVec (a cartographic product by Natural Resources Canada), and geospatial data from the Manitoba Land Initiative. Environment Canada's Web site was monitored on a regular basis for the latest weather conditions and forecasts to continuously gauge stream flows. Real-time weather data and topographic information were also combined to predict future outcomes and trigger evacuation events. The team then developed and displayed a multitude of ArcGIS online services layers of the COP to represent personal care homes, emergency medical services (EMS) facilities, helicopter landing zones, hospitals, ring dikes, ice jams, broken bridges, and ambulances. Using intuitive symbology, these layers were easily interpreted and allowed users to zero in on problem areas for effective analysis. The team also extracted road segment data from the Medical Transportation Coordination Centre and incorporated it into the COP to communicate road closures. Intuitive symbology and real-time data empowered ODM to provide effective support to operations on the ground and quickly solve challenges, such as ice jams and road closures. "Our group had limited knowledge of GIS, and there was no time to secure additional resources," says Gerry Delorme, director, ODM. "However, the common operating picture was so intuitive and easy to use that it allowed us to align all our goals into a single platform and be fully operational quicker than I ever imagined possible." In around-the-clock operations, ODM referred to the COP to conduct thorough data analysis, make 20 to 30 critical decisions each day, and address the four stages of emergency management. During the mitigation phase, the tool provided an answer to the question, Where has there been a flood like this before? Using the Live Maps layer, ODM was able to sift through data from similar floods in 1950, 1979, and 1997 to uncover recurring patterns.
During the preparedness phase, there was concern that the Red River Floodway would not divert enough water and that ice jams would block the floodway. If this had happened, ODM would have needed to quickly identify residents to prioritize for evacuation. To take a proactive approach, it leveraged the COP's ArcGIS online services to generate demographic reports that revealed information such as the percentage of senior citizens in a specific area. The COP addressed the response phase of emergency management by enabling ODM to monitor environmental factors affecting the flood, such as heavy rainfall. Links to weather stations throughout the province provided a constant update on the latest weather conditions and forecasts. The COP also enabled ODM to investigate stream gauges in individual communities to determine how specific areas would be impacted by the flood during peak times and coordinate response activities. Finally, during the recovery phase, ODM was able to look back at a historical record of flood activity and analyze RadarSAT data from earth observation satellites to view polygons that marked the flooded areas. In addition to serving as a powerful decision-making and problem-solving tool, the COP was used during ministerial briefs with the deputy minister to explain and justify emergency management planning. The ability to communicate effectively meant that operational response times were greatly reduced, and ODM could focus on taking action to ensure the safety of Manitoba residents. This fusion of critical information allowed collaborative planning during one of the most severe natural disasters in Manitoba's history. "The COP was the first thing we looked at every morning," explains Delorme. "The ability to assess what had happened since we last looked at the application and what was currently happening helped us form quick and confident predictions about where things were headed." Looking forward, ODM will continue to integrate more data sources into the COP, including a recently purchased public alert communication system. ODM also plans to use the tool to monitor ambulances and hospital bed counts in cases of emergency. More InformationFor more information, contact Gerry Delorme, director, ODM (e-mail: gerry.delorme@gov.mb.ca). |