ArcGIS Online: What's New?
This regular column contains information about the latest updates to ArcGIS Online basemaps; new content contributed by Esri and the user community; and information about the latest release of ArcGIS.com, the website for online content.
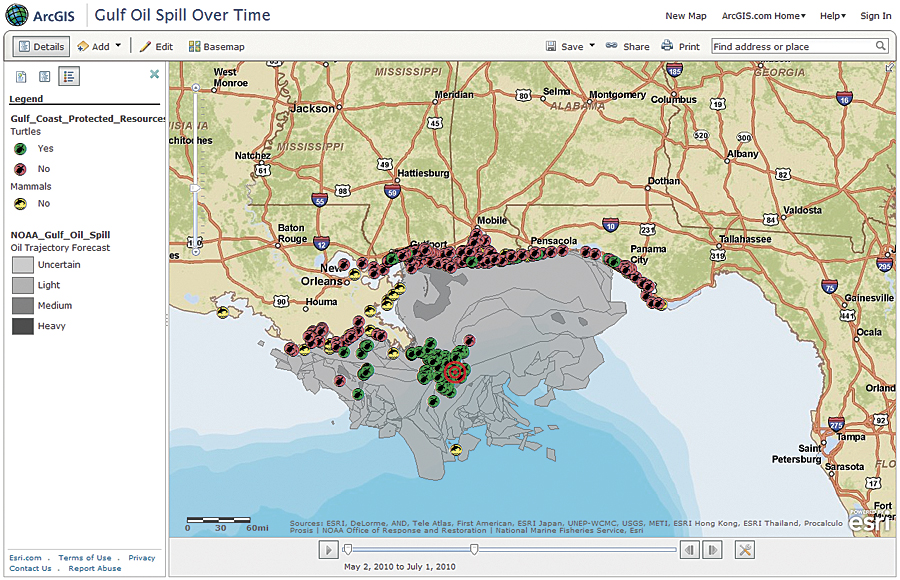
View and configure time-enabled maps that include temporal services.
Map Services
The World Street Map has been updated with new content and expanded coverage for several countries in South America and Australia. Detailed street-level data has been added for Argentina, Brazil, Chile, Venezuela, Australia, and New Zealand. The World Imagery map is also being expanded with additional detailed imagery for large parts of the world using GeoEye IKONOS 1-meter resolution.
Image Services
The Landsat Community is a new group that includes Landsat imagery hosted by Esri, as well as related maps and applications created by the user community. The Global Land Survey datasets are created by the US Geological Survey and the National Aeronautics and Space Administration using Landsat images. These global, minimal-cloud-cover, orthorectified Landsat data products support global assessments of land cover, land-cover change, and ecosystem dynamics, such as disturbance and vegetation health. Landsat represents the world's longest continuously acquired collection of space-based, moderate-resolution land remote-sensing data change research. These maps are provided as dynamic image services, allowing customers to explore the important information within this imagery. This includes band combination analysis for visualization (such as natural color, infrared, vegetative change, and Normalized Difference Vegetation Index), as well as many years of imagery to look at changes over time (1975, 1990, 2000, and 2005).
Geocoding Task Services
Updates have also been made to the World Geocoding task services. The ArcGIS 10 software-style North American Address Locator is a composite geocoder that supports multiple levels of geocoding in the United States and Canada. Addresses in the United States can be geocoded using street address point, street address, ZIP Code, ZIP+4, or city/state. Addresses in Canada can be geocoded using street address, street name, postal code, or city/province. The locator accepts both single-line and multiline input addresses and can be used to geocode single addresses, reverse geocode, or batch geocode up to 10 addresses per request. A separate United States Street Locator is also available. It is designed to support street address-level geocoding for the United States only.
The European Address Locator is a composite geocoder that supports multiple levels of geocoding, including street address, street name, city, and postal code. The locator for Europe covers, completely or partially, the following countries and regions: Andorra, Austria, Belgium, Denmark, Finland, France, Germany, Gibraltar, Ireland, Italy, Liechtenstein, Luxembourg, Monaco, the Netherlands, Norway, Portugal, San Marino, Spain, Sweden, Switzerland, the United Kingdom, and Vatican City.
The World Places Locator lets users geocode various types of places around the world and accepts single-line plane name input, for example, Paris or Paris, France, and returns results sorted by match score and rank. Users can geocode single places or batch geocode up to 10 places per request.
These geocoding services are free of charge and will batch geocode up to 1,000 addresses per year. Users needing to batch geocode more than 1,000 addresses per year have the option of purchasing an annual subscription for blocks of 25,000 batch geocodes. They can deploy these same geocoding solutions on their private networks for use in ArcGIS or custom applications using Esri StreetMap Premium or ArcGIS Data Appliance. In addition, free locator templates are available for all users who want to build their own geocoding solutions using their own data or supplement Esri's existing locators with specific data.
New Free Online Tools That Bring Maps to Life
The latest update to the ArcGIS Online website includes many additions and improvements that make it easy to design great-looking web maps to share with others, embed in web pages or blogs, or use in web applications.
Users can now add pop-up windows, create editable layers, and use time-enabled web maps using the ArcGIS web map viewer or ArcGIS Explorer Online, both accessible via ArcGIS.com. They can then share and use these maps in other ArcGIS clients, such as ArcGIS Desktop and ArcGIS apps for smartphones.
Pop-up Windows
Pop-up windows are useful for conveying pertinent and detailed information about specific features in web maps. Information for pop-up windows can come from either an editable layer created directly in the map or an existing service layer that someone else published and users want to add to the map. For example, users creating hiking trails maps can provide details by adding a pop-up window for each trail to display a title, brief description, photo or image, and a URL to a related website.
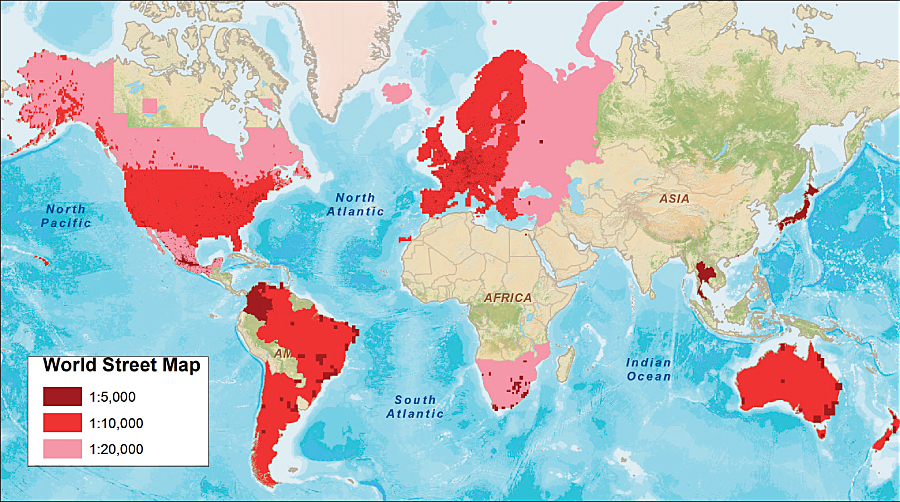
Updates to the World Street Map include street data at large scale for a number of locations around the world.
Users can also display different types of charts in the pop-up window for comparing information or showing statistics for a particular population or location, such as consumer spending behavior in different market areas. When working with service layers that someone else created and published, users have feature-specific information derived from the attribute set available in the map or feature service. They can still configure pop-up windows, but any text or formatting will apply to all pop-up windows. Users working with a map service that they own can save pop-up window configurations as a layer property so the pop-up windows are automatically enabled on other web maps that include the service.
Ability to Edit Layers—The Key to Crowdsourcing
There are two ways to add an editable layer to an ArcGIS web map: (1) adding an existing feature service layer from ArcGIS Server or (2) creating an editable layer directly in the ArcGIS web map viewer or ArcGIS Explorer Online.
Features from a feature service layer can be edited by anyone who has access to the map. This works well for crowdsourcing maps and applications where users want feedback from many people and want everyone to see all the edits. Public-facing 311 web applications are a good example. Citizens can report potholes, graffiti, property damage, and other problems in their community. Images or photos that are uploaded are displayed in a pop-up window along with any additional information. Users who don't have ArcGIS Server to create a feature service layer and just want to display more detailed information about certain features on the map can do that easily by creating an editable layer directly in the ArcGIS web map viewer or ArcGIS Explorer Online.
They can choose from six symbol templates organized by category. For example, Map Notes includes pushpins, arrows, and lines; Park Planning includes symbols for picnic areas, bicycle trails, and points of interest; and Oil & Gas Infrastructure includes symbols for oil refineries, treatment facilities, and types of pipelines. Once users select the desired symbol template, they can simply add symbols to the map by clicking a location. They can then add descriptive information in a map note pop-up window and customize the symbols by choosing a different color palette or adding their own custom symbols by referencing a URL.
Adding or removing features is as easy as going back to the web map and clicking the Edit button. Adding their own features to a map is a great way to display custom information users want to share with their audience. By default, web maps created with the ArcGIS web map viewer or ArcGIS Explorer Online are not shared. If a map is shared publicly, users can embed it in their web page or blog, e-mail the map URL to friends, or share it on Twitter or Facebook. If a map is shared in ArcGIS Online publicly or with specific groups, others can find and copy it for their own map, augment it with additional layers to create a mashup, then save it as their own map and share their version. This is one of the powerful yet easy ways to collaborate and create content that others will find useful.
Configuring Time-Enabled Maps
Support for time-enabled maps became available with ArcGIS Server 10 and now has been added to the ArcGIS web map viewer and ArcGIS Explorer. Now, when creating web maps, users can add a published temporal service to the map directly within the viewer. Whether creating a time-enabled map or working with one that was created and shared by someone else, users can configure the time slider that appears at the bottom of the map. First, they can play the time sequence to see how information has changed over time, then, using the slider controls, configure the playback speed, time span, time window, and slider labels. For example, the time span shows the timeline of each time-enabled layer in the map, so users can compare the timeline of separate layers to each other. They can display time in discrete units or cumulatively and only show data that falls within the time window. Time-enabled maps show trends, patterns, and changes in data over time. High demand exists for these types of maps, especially during natural disasters, when they are instrumental to personnel planning and managing the response to crises. The public can also follow news and developments via online maps to get a clear understanding of the impact of a disaster over time, whether it's an oil spill, an earthquake, a wildfire, or the spread of a communicable disease.
Share Presentations Using ArcGIS Explorer Online
Users can now easily share "presentation" slide shows in the new version of ArcGIS Explorer Online. Direct URL access makes it much simpler to share presentations with those who have never used the application before. The presentation interface in ArcGIS Explorer Online enables users to easily make dynamic interactive presentations in minutes.
To start using ArcGIS Online content and capabilities, visit ArcGIS.com.