Canadian Deforestation Mapping and Carbon Accounting for Kyoto Agreement
Highlights
- The convergence of GIS imagery aids CFS to meet its wide range of imagery requirements and maximize the value of its spatial data.
- ArcGIS delineates individual deforestation events and stores each one's accompanying attribute details.
- ArcGIS is used for data management and analysis that support the understanding of forest events.
Canada grows 10 percent of the world's forest cover and 30 percent of the world's boreal forest. There are approximately 347.7 million hectares of forests in Canada. During the past 35–40 years, Canada has converted 3.3 million hectares of its forestland to other uses, which is about 1 percent of its total forested area.
Canada is a signatory of the Kyoto Protocol and is obligated to report greenhouse gas sources and sinks associated with aforestation and deforestation. To do so, it has implemented a national forest sector carbon accounting system that brings together data from multiple resources, including a national forest inventory, growth and yield data from sample plots, statistics on change agents, and land-use change calculated from remote-sensing data. The accounting method integrates image processing and GIS analysis to monitor deforestation and calculate the carbon storage and changes, which are essential for Canadian national assessments.
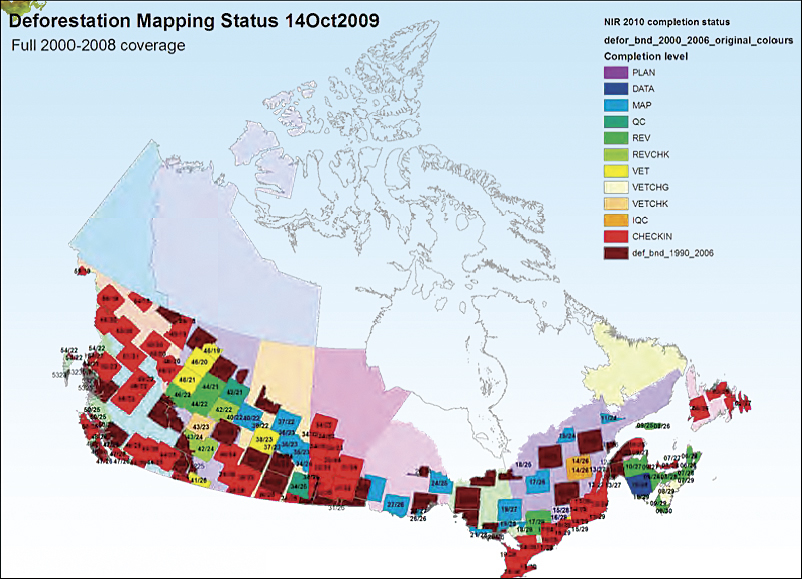
Status of the deforestation mapping project is shown by sector.
The process was begun by developing standards for consistency that can be used for data review across the country, as well as meeting the measurement standards of the United Nations Framework Convention on Climate Change (UNFCCC), which is the international environmental treaty to which Canada has agreed.
Canada's forest carbon reporting system is called the National Forest Carbon Monitoring, Accounting and Reporting system. The Canadian Forest Service (CFS) uses the Carbon Budget Model of the Canadian Forest Sector within this system to estimate emissions and removals associated with land conversions to and from Canada's forests. Researchers use the Carbon Budget Model to assess carbon stock change over time. This model simulates forest carbon stocks in aboveground and belowground biomass, litter, deadwood, and organic carbon soil. The results of analyses are included in Canada's annual greenhouse gas inventory and National Inventory Report. Estimates date back to 1990.
The Natural Resources Canada—Canadian Forest Service tracks what is happening to the country's forestlands—specifically, where and when deforestation has occurred and into what the forest has been transformed. CFS monitors causes of land-use change, such as from urban development.
The measurement of forest change provides factors applied to carbon calculation models required by UNFCCC. This data also provides regulators and policy makers with a basis for developing sustainable forest plans.
The measurement process begins from above with Landsat imagery and aerial photography. Landsat multispectral earth-orbiting satellites, developed by the National Aeronautics and Space Administration (NASA), scan Canada's vast forests using sensors to digitally record reflected and emitted energy from the earth in various wavelengths of the electromagnetic spectrum and store it in an archive. This is an enormous amount of data to consider. To meet UNFCCC accounting requirements, CFS tries to sample the same areas repeatedly to examine change over time. The time periods used are 1975–1990, 1990–2000, and 2000–2008. Landsat multispectral scanner was used for 1975, and Landsat Thematic Mapper and Enhanced Thematic Mapper Plus were used for subsequent time periods.
Spatial sampling methods also make accounting feasible. A grid is laid over the imagery, and cells within the grid are sampled to assess land-use change. Sampling density varies depending on the expected rate of deforestation, and 6 to 12 percent of an area inspected may be sampled. The area for each deforestation event is rated against all the cells inspected and detailed in each deforestation category class.
Areas of change in the imagery are detected and flagged. Imagery is displayed in ArcGIS, which CFS has used for years, and shows where change has occurred, highlights potential areas of forest clearing, and compares imagery from different years. Then forestry specialists take over the interpretive analysis. Events are classified in accordance with the Deforestation Interpretation Guide (DIG) provided by Natural Resources Canada. This way, everyone uses the same standard definition, which supports consistent interpretation across the country. To verify Landsat imagery interpretation, experts use aerial photos, forest inventory, road networks, gravel pit licenses, and oil and gas facility data. The imagery dataset contains more than 70,000 photos for land-use verification.
Data samples are scrutinized and validated using quality control processes, such as expert judgment, anecdotal evidence, record data, estimate allowances, and uncertainty analyses. ArcGIS delineates individual deforestation events and stores each one's accompanying attribute details, which is valuable for summarizing larger-scale land-use changes. Annual deforestation events are interpolated between time periods and extrapolated to produce annual rates of change.
The deforestation monitoring group is working with Canada's National Forestry Information System (NFIS) that makes forest data available to the public. The public is invited to view and provide its local knowledge on deforestation events used in the calculation of Canada's deforestation rates. The site can be accessed at nfis.org.
Esri and Esri Partner PCI Geomatics have now fully integrated their GIS and imagery capabilities to help GIS users make efficient use of their growing volumes of imagery datasets. To process its imagery, Pacific Forestry Centre (PFC) uses Geomatica remote-sensing software, provided by PCI Geomatics, and ArcGIS. PFC also uses Geomatica's image processing tools to orthorectify and enhance Landsat imagery and build image stacks for change detection. ArcGIS is used for data management and analysis that support the understanding of forest events. CFS uses a Live Links tool linking the cursor position on both ArcGIS and Geomatica displays, thereby allowing both systems to be used simultaneously.
Resource managers use this integrated platform for imagery solutions as a complete system for managing, disseminating, visualizing, and analyzing spatial data. The valuable information provides the scientific basis for Canada's forest carbon accounting system.
Canada's National Forest Carbon Monitoring, Accounting and Reporting system has engaged provincial and territorial governments and private industry. Provincial and territorial governments have contributed to the project by mapping deforestation, supplying imagery and geospatial data, doing ground truthing, and giving expert advice. In addition, various consulting firms throughout the country have been qualified to provide mapping services based on the standard DIG methodologies.
For more information, contact Andrew Dyk, deforestation monitoring coordinator, Natural Resources Canada (e-mail: Andrew.Dyk@nrcan.gc.ca). Learn more about Esri's GIS solutions for climate change at esri.com/climatechange and forest management at esri.com/forest and PCI Geomatics imagery technologies at pcigeomatics.com. Special thanks go to CFS' Andrew Dyk, Donald G. Leckie, and Sally Tinis for providing the information for this article.