How Changes to the US Census 2010 Can Impact Users' Decisions
Esri Innovations Simplify American Community Survey Data
Highlights
- Esri released American Community Survey (ACS) reports from two of Esri's Software as a Service (SaaS) cloud solutions, Business Analyst Online (BAO) and Community Analyst.
- ACS data is available to map via color-coded maps and Smart Map Search.
- Esri is providing the ACS data for nonstandard geographies that are not available from the Census Bureau.
In 2010, the Census Bureau changed how it collects decennial census data. The bureau eliminated the traditional long form and opted to release only the data collected from the census short form. Information previously obtained from the long form is now provided in the American Community Survey (ACS), a rolling survey that represents a period of time instead of one point in time. Data such as income; education; employment; language; migration; poverty; travel time to work; vehicles available; marital status; and housing characteristics, such as value and rent, previously available from the long form, will now come from the ACS. This survey provides updates annually instead of decennially like the census long form; however, the sample size is much smaller than the census sample, which requires reporting a Margin of Error (MOE) with each ACS estimate.
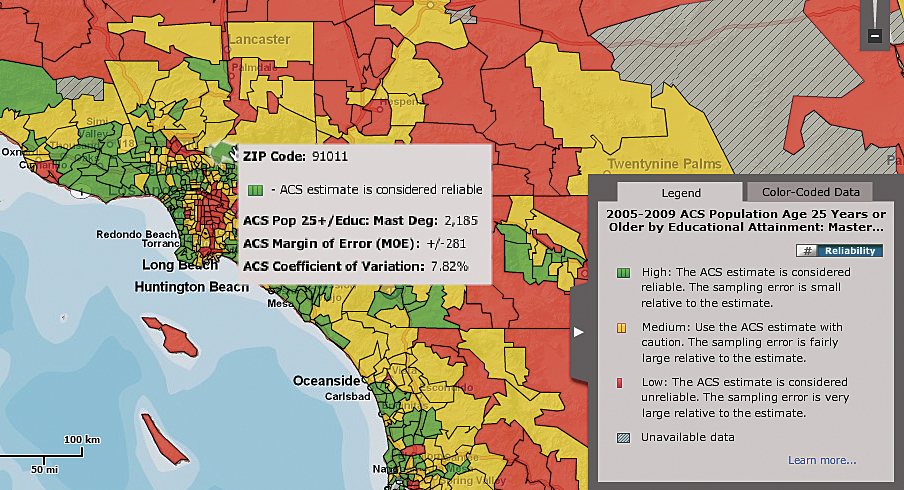
This example shows the ACS data thematically mapped by ZIP Code for an area near Los Angeles. Users can easily see the ACS MOE, the color-coded reliability symbols, and information about the estimate. For greater understanding of the data, reliability symbols in the BAO ACS report use the same colors.
What Is the ACS Margin of Error?
All survey-based estimates are subject to sampling error. The MOE measures the variability of the estimate due to sampling error. ACS MOEs enable data users to measure the range of uncertainty for each estimate with 90 percent confidence. The range of uncertainty, called the confidence interval, is calculated by taking the estimate plus or minus (+/-) the MOE. For example, if the ACS reports an estimate of 100 with an MOE of +/- 20, there is a 90 percent certainty that the value for the whole population falls between 80 and 120. The larger the MOE, the lower the estimate's precision.
How Can These Data Changes Impact Users?
Ignoring the MOE could easily lead a data user to mistake sampling error for a trend or affect analysis results. For example, state and local agencies could underestimate the population in poverty and lose funding for vital government services. Companies could misinterpret household and income and fail to locate in a profitable area.
Simplifying ACS Data Usage
To make it simpler to explore and use the ACS data and interpret the ACS MOE, Esri's data development team devised a system of reliability symbols that indicate when users can depend on the ACS sample estimate or when the sampling error becomes too large relative to the size of the estimate.
The proprietary reliability symbols are the following:
 | High Reliability: The ACS estimate is considered to be reliable. The sampling error is small relative to the estimate. |
 | Medium Reliability: Use the ACS estimate with caution. The sampling error is fairly large relative to the estimate. |
 | Low Reliability: The ACS estimate is considered unreliable. The sampling error is very large relative to the estimate. |
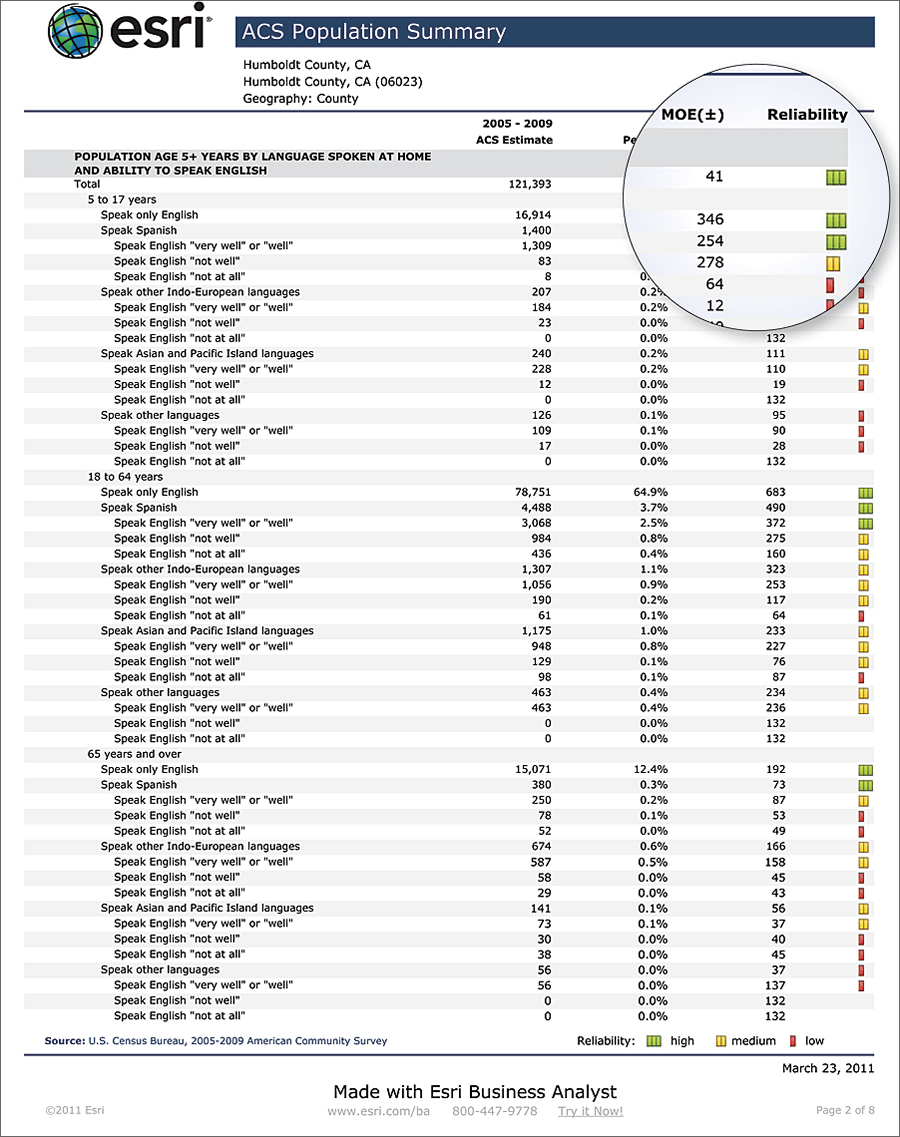
Users can immediately gauge the accuracy of ACS estimates by the reliability symbols devised by the Esri data development team. This cutout of the ACS Population Summary report from BAO shows the ACS estimates, the percentages, the MOEs, and the reliability symbols.
ACS Data in Nonstandard Geographies
For more customized analysis, Esri is also providing the ACS data for nonstandard geographies that are not available from the Census Bureau, including ZIP Codes. "More than half of data users employ rings, drive times, and hand-drawn shapes in their analyses," says Catherine Spisszak, Esri data product manager. "Esri provides ACS data for these nonstandard geographies."
Esri's data team created an algorithm to calculate the ACS MOE for these nonstandard areas. Because data users frequently use nonstandard geographies when conducting trade area analyses, this innovation will ensure actionable results. For more traditional studies, Esri also provides the reports in standard census geographies, such as states, counties, census tracts, and block groups.
How Can Users Access the ACS Reports?
Two ACS reports that include Esri's reliability symbols are now available in Business Analyst Online and Community Analyst and contain data from the 2005–2009 American Community Survey. Read "Map ACS Data in Esri Business Analyst Online and Community Analyst" to learn more.
- ACS Population Summary—Demographic variables include marital status, language spoken at home, school enrollment, income, and more.
- ACS Housing Summary—Housing information includes home value, mortgage status, rent, vehicles available, and more.
In addition to these two reports, ACS data is available as color-coded maps and for use in Smart Map Search. Users can thematically map the ACS estimates and view the associated reliability for the estimates.
Business Analyst Desktop and Business Analyst Server users can access and integrate the ACS data and reports immediately via the Business Analyst Online APIs.
For more information, visit esri.com/acs or call 1-800-447-9778.
See also "Map ACS Data in Esri Business Analyst Online and Community Analyst."