Winter 2001/2002
Winter 2001/2002 |
|||||||
|
|
|||||||
Mapping Livestock Nutrient Plans with GIS
EPA's Clean Water Act Requires Animal Waste Management Planning |
|||||||
To reduce nonpoint source contamination of surface water and groundwater, the U.S. Environmental Protection Agency (EPA) has proposed regulations under the Clean Water Act that will require animal feeding operations and concentrated animal feeding operations above a defined size threshold to develop and maintain a Comprehensive Nutrient Management Plan (CNMP). The new rules will be finalized by December 2002. CNMPs contain many elements, one portion of which is a Manure Management Plan (MMP). Elements of an MMP include number of animals and rations, type and capacity of waste storage facilities, transport and application equipment, fields used for disposal of waste, sensitive area definitions (buffer zones), cropping patterns, and nutrient needs. Ted Hartsig with Sustainable Environmental Solutions, Inc., in Lenexa, Kansas, believes that the mapping component of developing a CNMP is the critical first step. "There are going to be a lot of people scrambling to get MMPs done once the new rules go into effect," says Hartsig. Hartsig estimates that up to 40,000 CNMPs would need to be produced nationwide based on the current wording in the proposed rules. The number may vary depending on the number of animal units required before a CNMP must be in place.
"The calculation of total acreage and usable acreage is key to the manure management process," says Hartsig. "Being able to visualize the GIS information (e.g., fields, subfields), soils data (from the Soil Survey Geographic Database [SSURGO]), and information from state and local sources is part of the reason why the spatial software solution is the best method to start working out an MMP." Hartsig's company does nutrient management work and is always looking for new tools to assist him in providing services to his clients. Through personal contacts he discovered the MMP project that VantagePoint Network, an Esri Business Partner, was working on with Purdue University. Purdue University has developed a software package to develop MMPs using tabular data. Purdue's MMP application accepts all the nonspatial information such as herd size, herd management practices, feed rations, and manure management infrastructure. Using the tabular data in conjunction with the spatial results (e.g., calculated acres, soil types, soil sample results), Purdue's MMP application determines the amount of manure to apply as well as when and where to apply it. To assist Hartsig and others who develop MMPs for their clientele, VantagePoint developed a spatial preprocessor for the Purdue MMP application. Esri's MapObjects was chosen as the tool to build the application around for several reasons: the ease with which a task-specific GIS application could be developed, the powerful spatial analysis operators it provides, and the flexibility of allowing projected vector data sets to display on top of raster data sets. Several of the GIS functions provided by MapObjects are essential to the MMP data processing scenario; these include user definition of geometric features, projection, buffering, intersection, union, and area calculation. Some traditional GIS tools were provided in the interface (e.g., pan, zoom, identify), but the goal of the application was not to develop a full-featured GIS application. Instead, the development goal was focused on task-specific functionality for creating the inputs needed to generate an MMP.
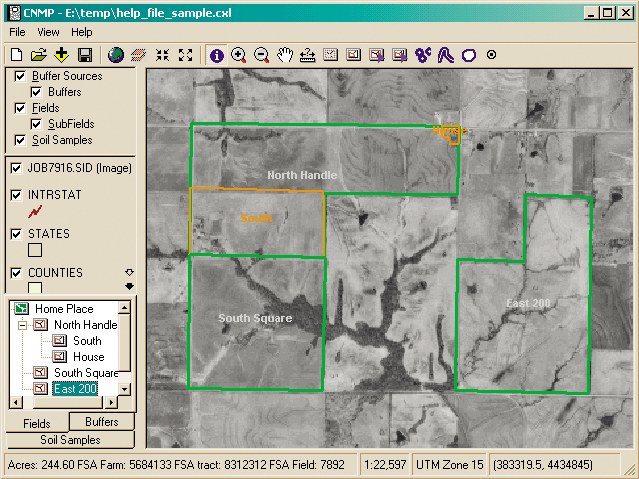
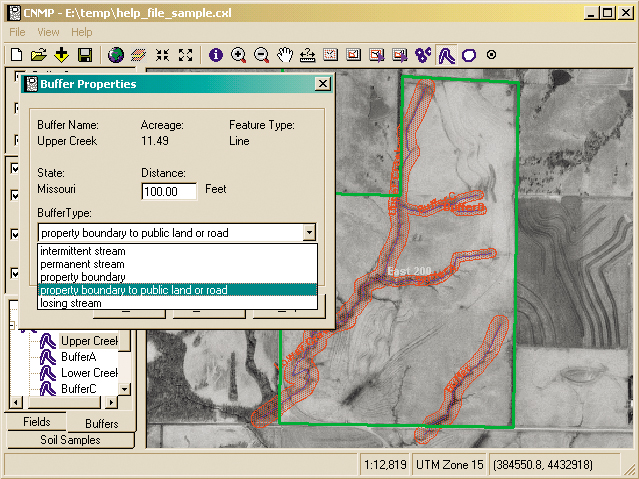
Using the MMP spatial preprocessor, Hartsig can heads-up digitize field boundaries using digital orthophoto quarter quadrangles (DOQQs) as a basemap (the DOQQ data is accessed using MapObjects software's built-in support for MrSID compressed imagery) or to import the field boundaries from a shapefile. Soil data comes from digital soil surveys stored in SSURGO. Once the fields have been delineated, Hartsig then defines sensitive areas such as wells and streams where manure cannot be applied. Buffer sizes depend on state-specific regulations. After spatially locating the feature to be buffered, Hartsig selects the buffer distance for the feature based on state-specific setback distances that are provided to him as drop-down choices by the application. Once the buffer areas are defined, the application automatically adjusts the field acreages by subtracting any acreage that falls within the buffer zones. "It's not just a paper map. Without a GIS-based system the overlapping areas of buffers, fields, and subfields would be extremely difficult, if not impossible, to calculate," says Hartsig. The MMP spatial preprocessor outputs the required information to the Purdue application for further processing. "Being able to integrate the information before jumping into the MMP process is an immense time-saver," says Hartsig.
Once all of the spatial components have been defined, the data is exported to the MMP application, either for the creation of a new plan or to update an existing one. Using the MMP application, other nonspatial information is entered (e.g., number of animals and rations). The MMP application allows for the allocation of manure to fields based on crop needs, soil type, and existing soil conditions while tracking the amount of manure produced and the amount that can be held in storage. The plan typically covers a five-year time span. A new plan is created when there are changes to herd size, herd management practices, feed rations, manure management infrastructure, etc. The calculation of spreadable acres (using the spatial overlay functionality provided by MapObjects) constitutes one of the core components in the creation of an MMP utilizing the spatial data preprocessor. This greatly reduces data input expense. "Field delineation in a user-friendly way is key, followed closely by the buffering and partitioning of the various acreages; the VantagePoint application allows me to do that," says Hartsig. Additionally, the mapping and reporting functionality enhances the usefulness of the MMP by generating maps and reports that can be taken to the field, illustrating where manure is to be applied, when to apply it, and the amount to apply. For more information, please contact A.J. Romanelli, GIS technical lead (e-mail: RomanelliAnthonyJ@JohnDeere.com, tel.: 970-266-4654) or Gary Schneider, project manager (e-mail: SchneiderGary@JohnDeere.com, tel.: 970-266-4624). |
 Field delineation and buffering of sensitive setback areas are the core components that must be worked through before developing an MMP.