Winter 2001/2002
Winter 2001/2002 |
|||||||
|
|
|||||||
Riverside County, California, School District Expands by 16,000 Students in 10 Years
GIS Helps Plan for K-12 Enrollment |
|||
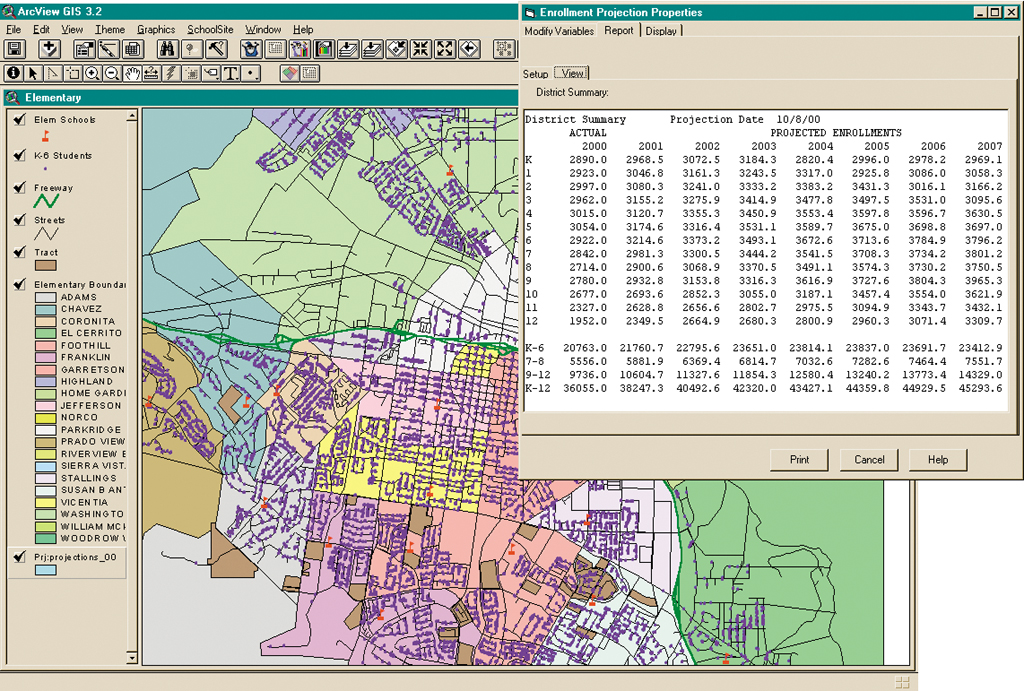
Over the last 10 years, the Corona-Norco Unified School District (CNUSD) in Riverside County, California, east of Los Angeles, has grown from 21,000 K-12 students to more than 37,300 students. To manage this large growth in student population, new school locations were analyzed and openings occurred for six elementary schools, along with a new intermediate and new high school. In addition, the location and placement of more than 485 portable classrooms were required to provide for growth and class size reduction initiatives at various other school sites. Finally, the addition of new schools and increases in facility capacities around the district required adjustments in attendance boundaries at more than a dozen schools to balance enrollment. Even with the monumental challenges of finding space to house the large numbers of incoming children, the Corona-Norco district was up to the task. The school district has been using a combination of ArcView and the SchoolSite Redistricting extension for ArcView to assist in the planning process. According to Lynda Jankel, manager of the facilities planning department at CNUSD, "The use of ArcView and SchoolSite has saved time, time, and more time. The use of GIS provides a quick response to staff and community queries and makes many needed planning tasks possible with a small staff." In the past, most school districts have manually coded student record data with planning area numbers based on their address and have utilized a great deal of IT staff time for producing tabular reports in any school attendance boundary change process. In many cases, special reports had to be developed to address the varied questions from staff and boundary committee members. The use of GIS has streamlined that process tremendously to the point where boundary changes have become a more participatory and interactive process. What took several people in different departments many days or weeks to accomplish can now be completed in a much shorter timeframe--and with more accuracy. "The Corona-Norco school district has handled growth and community issues extremely well over the last 10 years. The district has one of the more advanced facility departments utilizing a rather small staff compared to many of the school districts that we work with," says Greg Davis of Davis Demographics & Planning, an Esri Business Partner and developer of the SchoolSite line of extensions for ArcView. In one particular year, the use of GIS allowed for the planning of attendance boundaries for the opening of the high school, the intermediate school, and two elementary schools (affecting 8,000 students altogether) and was accomplished "all by myself," says Jankel. "Because the district has grown so quickly in such a short amount of time," she says, "the district could not afford to hire the personnel required to accomplish all of the tasks in opening the new school sites. GIS was essential in the process. ArcView, SchoolSite, and I are best buddies; I could not do my job without them." In addition to the use of ArcView and the SchoolSite Redistricting extension within the planning department, the school district has contracted with Davis Demographics to assist with a variety of other planning tasks. These tasks have included long-range enrollment forecasting, residential development mapping, and determining the number of students generated from various housing types for developer fee and housing impact studies. All of these analyses were performed by Davis Demographics using ArcView and the SchoolSite Enrollment Forecasting extension for ArcView. Projected enrollment can be displayed graphically within ArcView, and can also be summarized and reported in a variety of formats and grade level configurations. The enrollment forecasts are tied to the mapping of planning areas and can be used to ascertain areas of future growth and decline for attendance boundary planning and future site location. The use of ArcView and SchoolSite has assisted the CNUSD in the boundary planning process in numerous additional ways. When planning attendance boundaries, the district is very sensitive to maintaining or developing boundaries that reflect the ethnic makeup of the district as a whole. The extensive reporting capability that GIS provides speeds this process tremendously. For more information, contact Greg Davis, Davis Demographics & Planning, Inc. (e-mail: gdavis@davisdemographics.com). |