Winter 2001/2002
Winter 2001/2002 |
|||||||
|
|
|||||||
Managing Chaos Relies on Fast, Accurate Information
New York City--Creating a Disaster Management GIS on the Fly |
|||
|
On September 11, 2001, New York City's Emergency Operations Center (EOC) was in all respects a state-of-the-art facility, ready for any crisis. Only three
But the EOC was not indestructible. When two jetliners slammed into 1 World Trade Center and 2 World Trade Center and the two skyscrapers collapsed, numerous fires started throughout the complex including one at the EOC's home, 7 World Trade Center. By the end of the day, all of that state-of-the-art equipment and data was no more. Suddenly Starting from ScratchAlthough no EOC personnel were in the center at the time, the loss to the City was nonetheless immense. At a time of unimaginable catastrophe, when the City needed the EOC's capabilities the most, those capabilities had to be regenerated virtually from scratch. GIS was an important element of the OEM mission. The OEM staff had GIS software from Esri and data about City facilities such as schools, hospitals, and nursing homes. They could map flood zones, evacuation routes, emergency transportation routes, and shelter locations--information needed to begin to recover from disaster. But now all this was gone. New York City's experience--reconstructing its GIS capabilities and then pushing those new capabilities to maximize efficiency--is one that contains valuable lessons for every other organization in the country that must deal with disaster recovery, especially in a post-September 11 world.
Perhaps the most valuable of these is the importance of data sharing and data integration across an organization. That is the strongly held view of Alan Leidner, director of Citywide GIS for the New York City Department of Information Technology and Telecommunications (DoITT). Leidner directed the mapping and GIS recovery operations of the City and is an outspoken advocate of GIS technology's abilities and potential. There are few things more valuable that a city can do to prepare for disaster than to invest in GIS data and systems to share GIS capabilities, Leidner argues. For the first couple of days, Leidner and his team had only a couple of workstations and a plotter from the Parks Department and a small amount of City data with which to work. They also had no permanent home and were forced to move twice in three days. The City requested help from Esri--already a vendor and consultant to many New York City agencies including the Office of Emergency Management--and from several hardware vendors. All responded with a deluge of software, workstations, servers, plotters, and other equipment. By Friday, September 14, a more permanent EOC was established on Pier 92, a large ship terminal on the Hudson River. The mapping center within the EOC was equipped with 20 GIS workstations and five plotters. Security was heavy, since the EOC itself was considered a prime target for any further terrorist attacks; armed patrol boats kept watch from the Hudson while soldiers with automatic weapons guarded the streetside entrances. Assembling and integrating GIS data for the EOC's mapping was the first overwhelming task. Historically, the spatial data of New York City was managed at the agency level. Interagency communication was sometimes problematic. The City was in the midst of developing a comprehensive enterprisewide GIS system, but the system was not yet ready for use. All this meant that data first had to be found and assembled from dozens of departments and agencies in the country's largest city, as well as from other government agencies outside the City, and from vendors such as Esri. Among those departments with the most comprehensive data were the New York City Department of Parks, the New York City Department of Finance, the Metropolitan Transit Authority, and the New York City Department of Environmental Protection (DEP). DEP, under the direction of another GIS champion, Wendy Dorf, had launched an initiative several years earlier to create the City's first accurate, planimetric basemap, generated in ArcInfo software from digital orthophotos. This basemap is known as NYCMAP (pronounced "nice map").
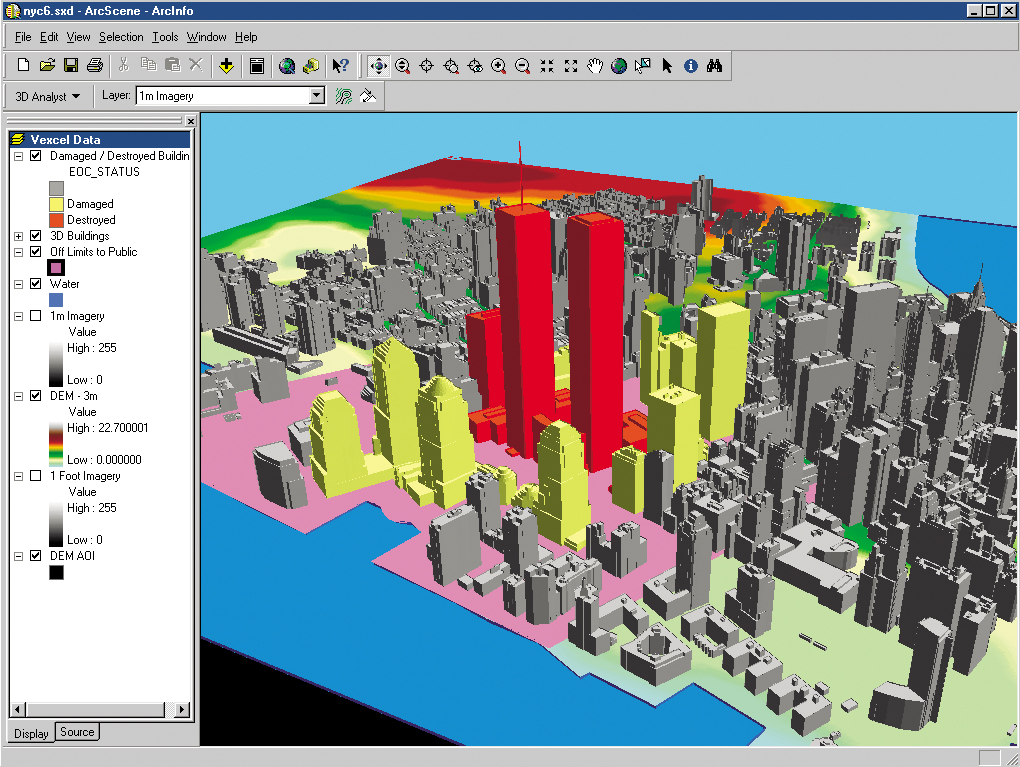
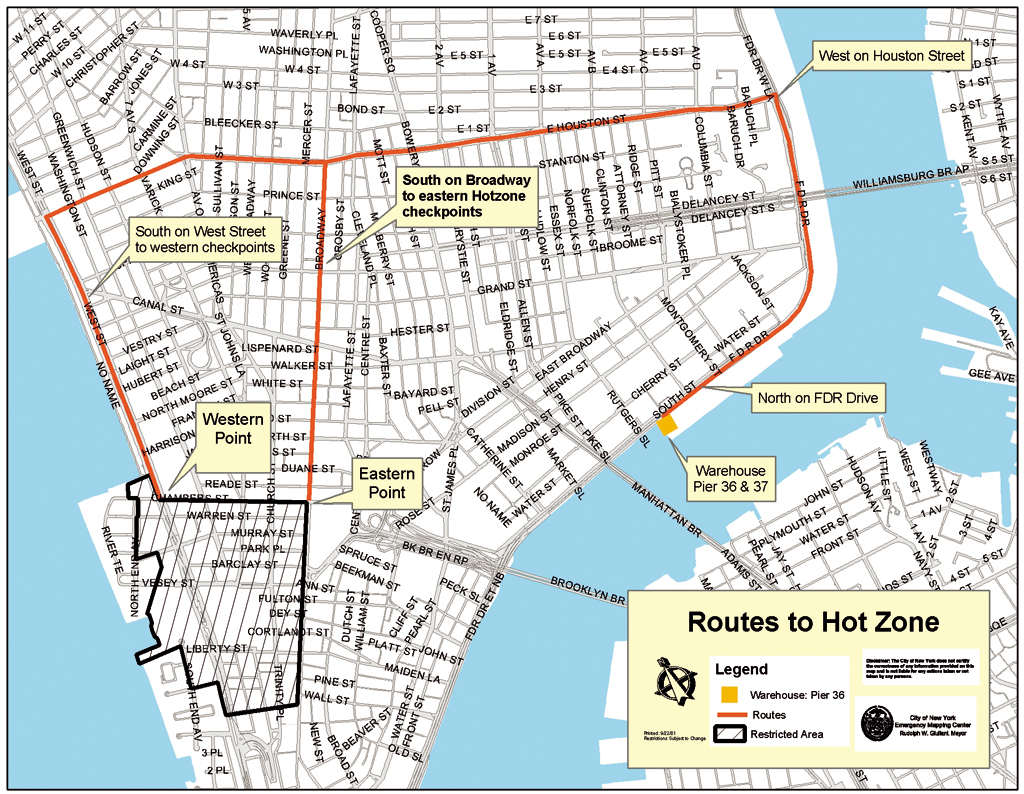
They were joined at Pier 92 by Susan Harwood, the New York City sales manager; Chris Schielein, Ray Carnes, Tom Pederson, and Anne Marie Flatley of the New York regional office, and Lori Sheinvold of the Philadelphia office. Helping lead the emergency response effort was Mike Tait, Esri Internet services manager, who happened to be in New York on Sept. 11, as was Kris Goodfellow, media industry manager. Also joining in the mapping efforts were City employees and staff from Plangraphics, Inc., an Esri Business Partner and contractor to the City to develop the enterprise GIS system. In Redlands, the Technical Support staff also went to 24-hour-a-day operation to support the mapping center. Esri employees from around the country eventually joined the mapping team at various stages. In those first hectic days, it was all mapping center staffers could do to simply keep up with the demand for maps, using ArcGIS software. The first maps were based on aerial photographs from the New York State Emergency Management Office and satellite images from Space Imaging, also an Esri Business Partner, which was the only reliable data available. Then, simple street maps were created with the aerial images and NYCMAP. Later, more complex maps were needed, largely due to the growing awareness in the EOC of what GIS was capable of doing; the more people knew about GIS, the more they wanted its capability. "People didn't realize that we were a GIS operation and that we could do analysis for them or that we could answer their specific questions," says Harwood. "But it didn't take long before people were coming in and asking for custom maps that focused on particular needs. Over time they began to request maps that were more complex and involved GIS analysis." Some of these requests were chilling: Harwood herself had to process a request to map all the concrete slab buildings over 10,000 square feet south of Canal Street, to be used as mortuary space. New data trickled in from disparate sources, often by hand, since there was no network connection from Pier 92, and using the Internet for sensitive geographic data was deemed to be insecure (although Geography Network provided census and other Data also came in from the field: command post locations, vehicle and pedestrian restrictions, utility outages, pedestrian and vehicle access zones, subway and bus line status, and river crossing access. This information was in high demand, and some was updated several times a day. This data became part of a growing list of standard map products, which in turn became a key component for public information, used by Mayor Rudolph Giuliani's office and posted on the New York City Web site. The mapping center developed another set of maps to help with the process of identifying damaged buildings, destroyed buildings, those in danger of collapse, and buildings needing cleanup. Daily updates of these maps were an important resource to provide to both residential and commercial tenants who were shut out of their buildings. The mapping center was also producing custom ArcView maps to respond to specific planning and analysis queries from City, state, and federal agencies. These included light detection and ranging (LIDAR)-based three-dimensional analysis maps of the debris field at Ground Zero, to monitor shifts in the debris pile. Thermal image maps helped federal urban search and rescue teams and the New York City Fire Department determine the relative distance of the fires to underground fuel storage tanks. Maps locating the freon tanks and oil fuel tanks at the World Trade Center site were created by overlaying the tank locations from CAD drawings onto thermal infrared data that showed fires and hot spots at Ground Zero. One result of all this mapmaking and analysis was that within a couple of weeks, the mapping center's system became unwieldy to work with, since it contained hundreds of shapefiles, image files, and ArcGIS map projects whose origin and metadata were often suspect. At the beginning, there was no time to do anything but crank out maps as quickly as possible, but such a system could not last forever. Streamlining OperationsEsri staff in Redlands worked with the New York City team to develop an online map request system that entered map requests into a database and provided a prioritized queue to the mapping staff. "We trained folks on how to use it and then wrote up a quick user manual," says Tait. "It made it much easier to track the status of a map request with all the specifics, including contact information, right there." The emergency mapping team also was able to leverage other map-based applications. For example, affected City departments were able to track events online with incident management software from E-Team, an Esri Business Partner, which also provided staff. The E-Team software is a Web-based emergency and event management software system that uses ArcIMS. Going Online Reduces Number in LineThe Emergency Management Online Locator System (EMOLS) was another example of leveraging an application for new purposes. Just before September 11, OEM had implemented EMOLS, a Web-based, ArcIMS application that let New York City residents enter an address and see the location of the nearest emergency shelter in the event of some natural disaster such as a hurricane. This capability was easily pivoted, after the attacks, to allow residents to find out whether they lived in a restricted sector and whether they were subject to any utility outages. But even as the workload began to become slightly less intense in late September, it became obvious that a better, more comprehensive system, with more horsepower, would need to be implemented if the mapping center was to continue serving New York City well. ArcSDE was the obvious solution to handling the large, complex work flows and map products. "We were getting lots of very high-resolution imagery," says Mike Tait. "People were very attracted to the image map products, but the process of creating these products slowed down mapmaking. We wanted to implement ArcSDE to streamline that process and give us better data management capabilities such as better cataloging and administration procedures for updating certain data sets." By early November, the mapping center had received more than 1,800 requests for maps, and it had generated more than 7,000 large-scale maps on plotters and many more thousands of small-scale, 8 1/2- x 11-inch maps. Value of GIS DemonstratedCertainly the value of GIS was demonstrated by the events of September 11 and afterward. Harwood says that any doubts anyone had about the power of GIS were erased. "It was very important to have the ability to rapidly create these maps--first simple ones, later complex ones and GIS analysis," says Harwood. "It was invaluable to have quick access to accurate maps from all of the different agencies from all over the City, including live data, and to be able to produce maps that were meaningful for the rescue workers, the mayor's office, and the public." A GIS for Managing a Disaster Needs to Respond QuicklyMuch of the value of a disaster GIS involves quick response, with data that is updated. Given that the OEM mapping center was completely destroyed, for the initial few days very few maps were available. This lack of information led to confusion and a reliance on intuitive judgment to make many decisions, but once information became available, its value was realized as an essential reference base. How many public agencies are prepared to quickly respond with a disaster GIS? Are data sources readily available? Are agencies prepared to immediately store their data? Who are the people who can instantly mobilize into a 24x7 workforce? All these are important questions that local government GIS users should ask themselves. GIS Is About IntegrationThere was much value in using GIS to integrate the data in New York City. The GIS put all the layers of information together for the first time. Departmental system data was used. People in a disaster need to understand how all the information from different departments is related geographically and how it connects and describes the whole urban organism. Tait says, "We need to recognize GIS is about integration and shouldn't stop with the successful implementation of one or more sets of functions. The good thing to come out of this is a clarity in our minds about the positive role that GIS can play in normal activities and especially how it can have an even greater impact if it's done in an enterprise context." He advocates creating an enterprise vision for aggregating project efforts and departmentalized data sets into an integrated system that is available for all of the groups within an organization. Other lessons include
For more information, contact Susan Harwood, Esri New York City Satellite Office (tel.: 212-349-3700, e-mail: sharwood@esri.com). |
 and one-half years old, the EOC was equipped with generators, backup generators, a water supply, and a ventilation system capable of filtering out 99 percent of airborne impurities as well as computer hardware, telephones, and radios with uninterruptible power supplies. Operated by the Mayor's Office of Emergency Management (OEM), the EOC was within walking distance of City Hall and most City agencies, and in a crisis it would operate as a self-contained headquarters from which the huge and diverse New York City government could operate. As many as 68 agencies could work there, with their software installed on workstations and direct links to data they would need. All of the equipment was housed within steel-framed, reinforced exterior walls designed to withstand 200-mile-an-hour winds.