Winter 2003/2004
Winter 2003/2004 |
|||||||
|
|
|||||||
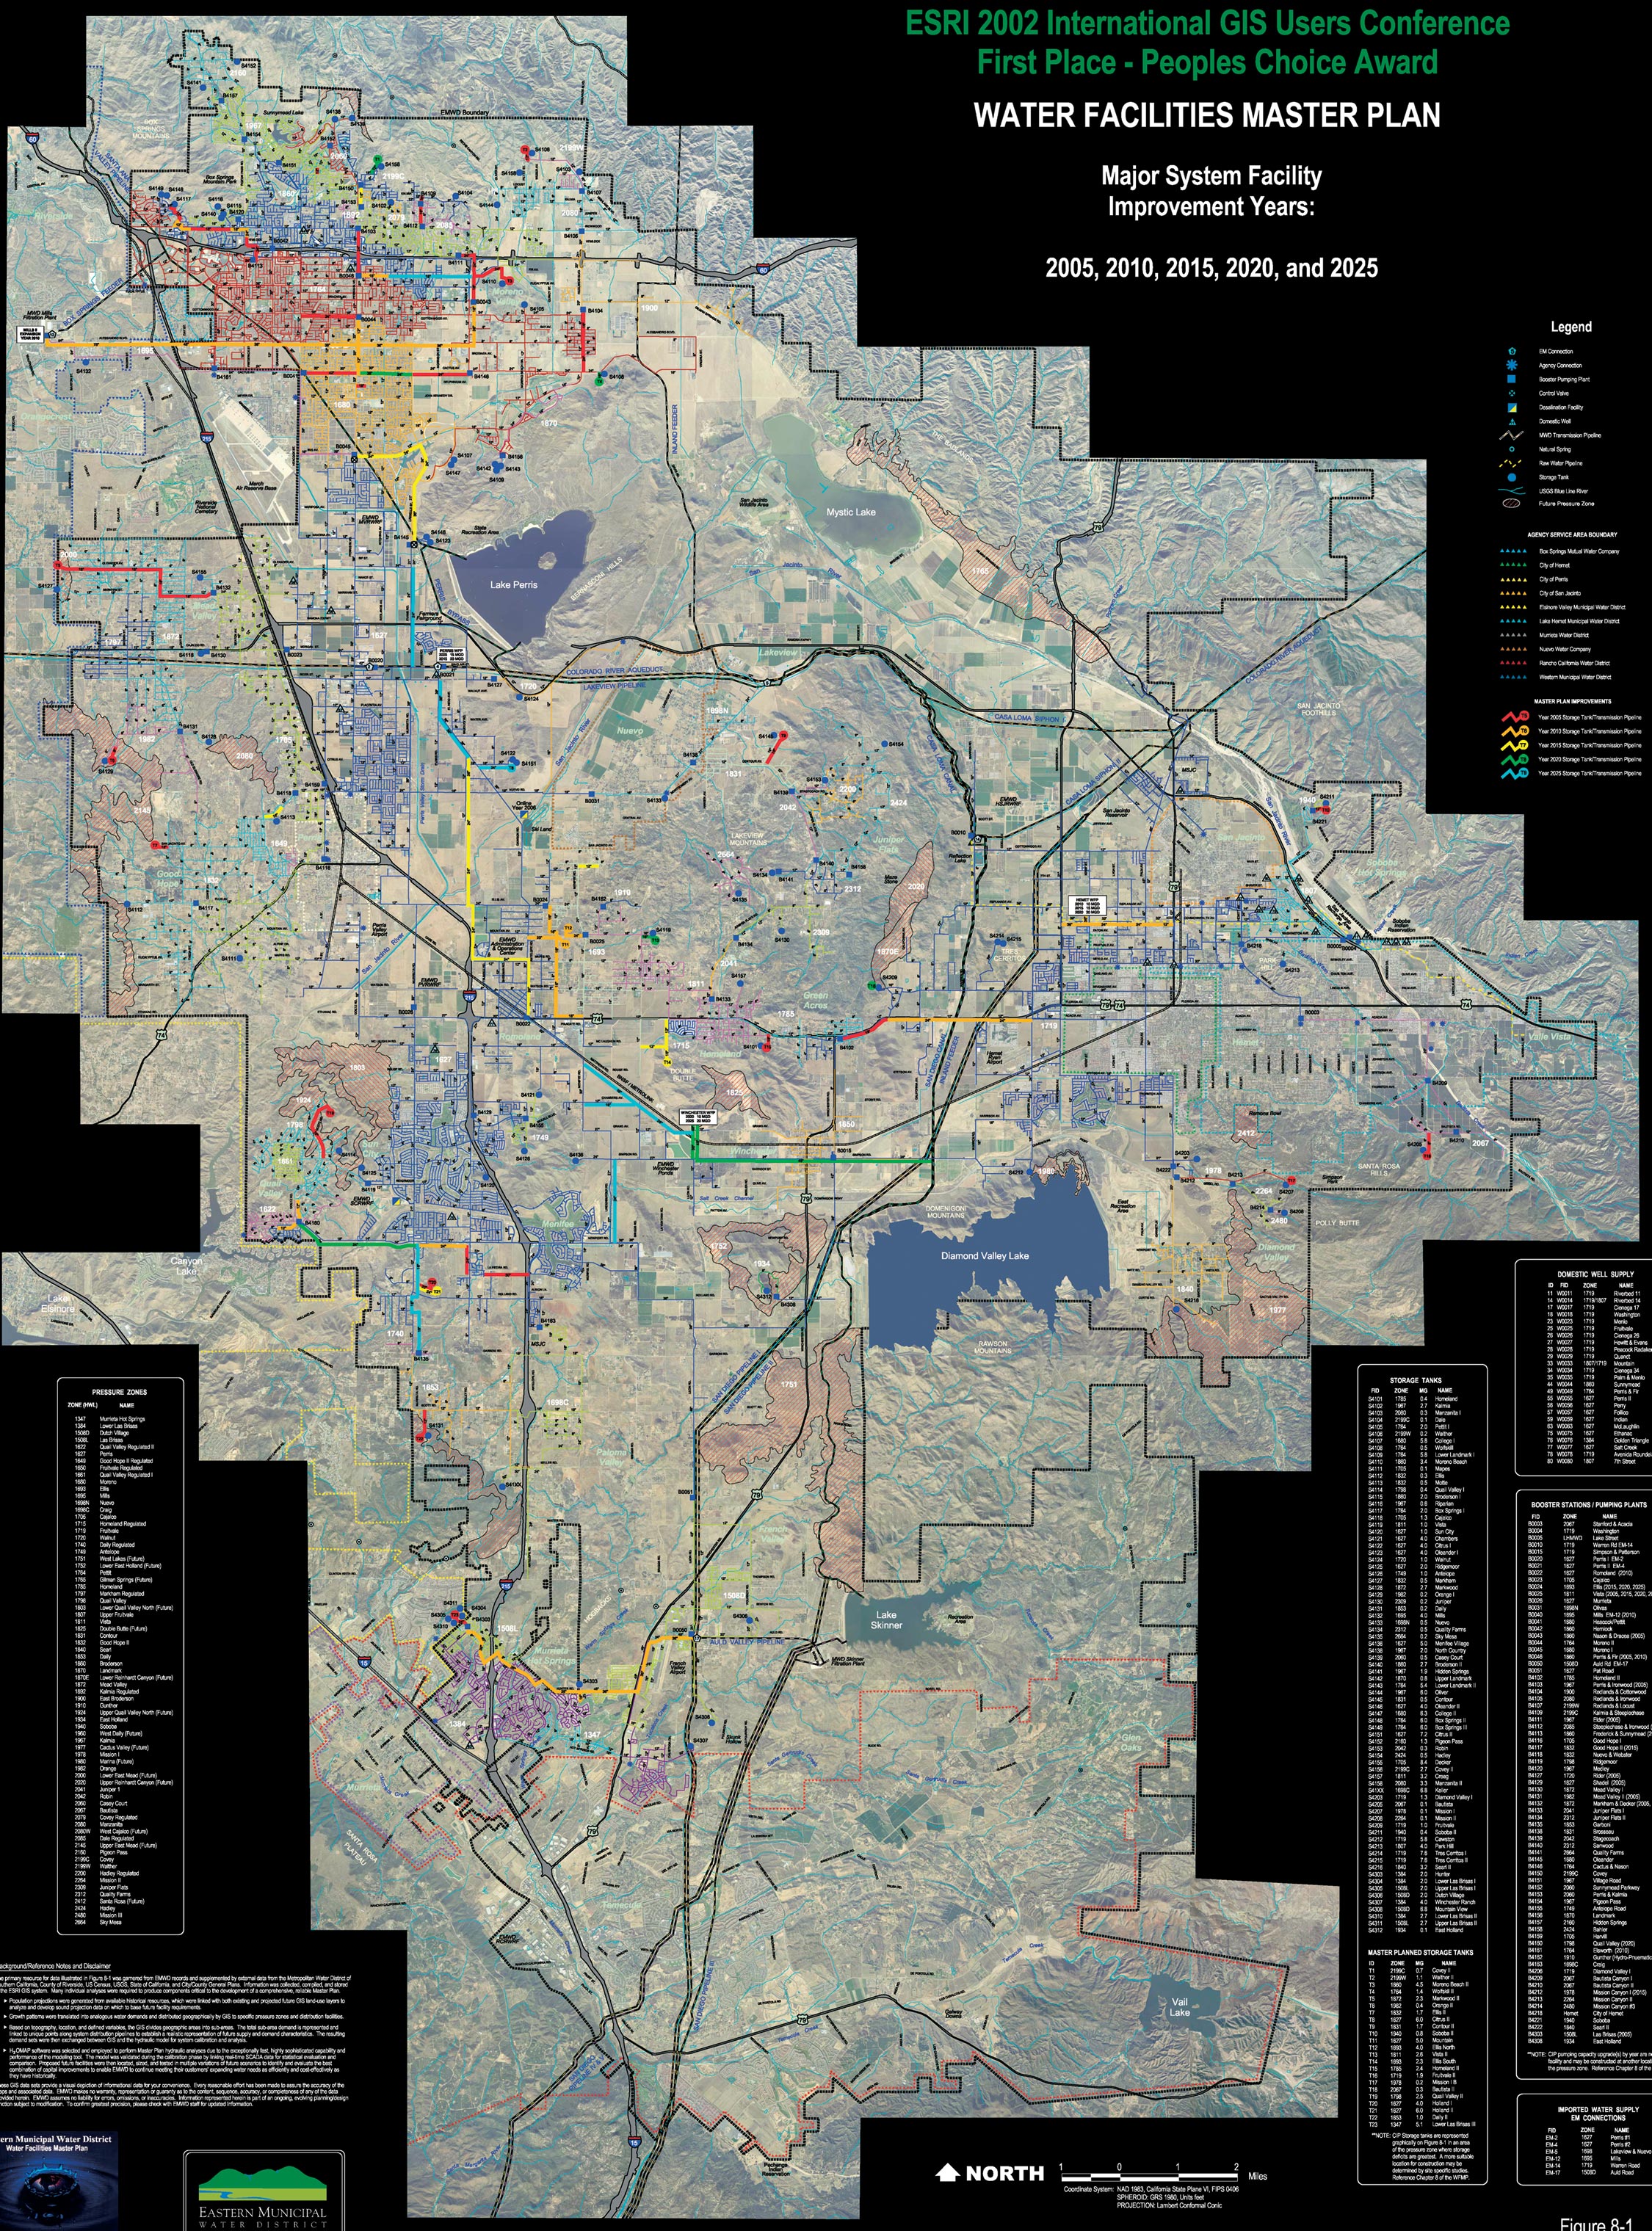
Mural Depicts Entire 25-Year Water Facilities Master Plan
In Riverside County, California, GIS Helps Water District Mapping |
|||
|
By Ruth Newsham, Hydraulic Modeler, Eastern Municipal Water District, and Erick Heath, Vice President, MWH Soft, Inc.
Hanging on the wall at the Eastern Municipal Water District (EMWD) headquarters in Riverside, California, is a four- by five-foot picture that's worth much more than a thousand words. Contained on its surface is an aerial photographic depiction of every acre in eastern Riverside County along with a symbolic representation of the water district's water supply system. Also included on the map are current and future improvements to the network. This map is only one of several that are the culmination of a comprehensive Water Facilities Master Plan project carried out by district employees with the help of GIS and advanced water modeling. This plan has become an integral part of the district's operations and maintenance activities; it is able to accommodate changes in demand, costs, and resources at a moment's notice while producing remarkably descriptive maps. GIS and Then SomeThe EMWD currently operates 61 separate pressure zones covering a total of 555 square miles and serving more than 500,000 residents. In addition, as a pioneer in the field of recycled water, the district has operated an extensive, interconnected recycled water system for years. To accurately predict domestic and recycled water demands and sewage flows for a system this complex, engineers rely heavily on land use and growth projections. Before GIS technology, melding these projections into one expansive, revealing picture was an arduous task. Map subareas were colored by hand, based on general plans collected from all involved cities, counties, and other jurisdictional agencies—each of which employed unique abbreviations, symbology, and updating of time frames. The arrival of GIS, specifically ArcInfo, in the early 1990s helped organize, consolidate, and analyze this information. However, EMWD needed a water utility specific analytical software tool to simulate system components realistically in a single model. Then, as serendipity would have it, a brochure about H2OMAP from Esri Business Partner MWH Soft, Inc. (Pasadena, California), was brought back from an American Water Works Association conference. The EMWD team was intrigued enough to call and ask for a demonstration of H2OMAP. Thereafter, district staff knew they had found their tool of choice. H2OMAP reads and shares native ArcInfo data and automatically constructs, skeletonizes, and analyzes a network model. For EMWD, the combination provides the ability to maintain a single detailed geospatial hydraulic model of its system that is easily and clearly updated and displayed. EMWD's current configuration includes ArcInfo 8.2 and ArcView 3.2 running on Sun Ultra 20 workstations, Dell Precision 650 workstations, and Dell OptiPlex GX260 desktops all backed by a Sun 420R server. In addition, H2OMAP 4.5 is running on standard desktop platforms. What EMWD created at the end of this 18-month project was an ideal framework for delivering a new, highly accurate Water Facilities Master Planning model that can readily adapt to unforeseen growth changes. Modeling the FutureThe agency's previous Water Facilities Master Planning was completed in 1990 when development was at an all-time high (21 percent growth rate). Southern Californians were also growing increasingly concerned about drought conditions they were experiencing at the time. A short time after that, in parallel with the economy, the bottom fell out for most development projects, reducing growth to 3.5 percent in 1996. Funding infrastructure quickly became politically unpopular. As quickly as it fell, the growth regained momentum, steadily increasing to the current robust rate exceeding 15 percent in most areas. This fluctuation, followed by sudden growth and coupled with an unusually high summer demand in 2001, underscored a number of deficiencies in EMWD's distribution system and its available water supply. Ambitious GoalsThe key goals of the new master plan were ambitious, going beyond the description of existing water system facilities, historic water use, and projected future demands. This plan was to include an evaluation of EMWD's existing system, recommend new facilities, update EMWD's phased water system improvement program, identify a strategic plan for future sources of water supply, and ascertain the total capital improvement costs (exceeding one-half billion dollars) determined/proposed by the new master plan. Even armed with the cutting edge capabilities and speed of GIS and related tools, the project proved to be a massive undertaking. Thanks to the combined power of technologies, the large, complex project—which would previously have been handled by a costly outside consultant staff of substantial size (15+ people)—was done completely in-house by a handful of people in half the time. The draft master plan was released to an enthusiastic reception with many comments on the comprehensiveness of the document and its many graphs, tables, and figures. Analysis results are displayed graphically in any color, size, or format for any variable. Even reports are generated in the format of choice. "In the 'old days,' developing facility costs was one of the most nerve-wracking components of master planning," says Peter Odencrans, EMWD spokesperson. "Every change—and there are always many—meant hours of work. With tools this sophisticated, making changes is effortless." The Four- by Five-Foot MapAdditional excitement was generated by the four- by five-foot map created for the project from this Water Facilities Master Plan by Charles Crider, an integral member of the master plan development team. To create it, Crider opened the GIS-native format H2OMAP data files of the finalized capital improvement projects from the master plan model directly into ArcView, color coded them by phasing, and overlaid them onto a highly detailed set of more than 300 aerial photographs that were also pulled from the master plan model. The stunning result depicts existing facilities of the complex network of pipelines including nearly 100 storage reservoirs and as many pump stations. EMWD's advanced water modeling solution and the Water Facilities Master Plan model, in particular, have continued to help staff respond to challenges with speed and flexibility in addition to helping communicate ideas clearly and concisely to city councils and the community. Odencrans concludes, "The maps we create from this master plan are impressive. In fact, after seeing how clear and thorough the graphics are, customers have remarked how much more confident they are with EMWD's planning efforts. With hundreds of millions of dollars in future capital projects, it's very important that staff can rely on accurate projections. This technology makes our jobs easier, faster, and more accurate." Crider entered the map in the annual Map Gallery competition at the Esri International User Conference in July 2002, winning the People's Choice Award. For more information, contact Ruth Newsham, hydraulic modeler with the Eastern Municipal Water District (tel.: 909-928-3777, ext. 4506; e-mail: newshamr@emwd.org; Web: www.emwd.org), or Erick Heath, MWH Soft, Inc. (tel.: 626-568-6855, e-mail: Erick.Heath@mwhsoft.com, Web: www.mwhsoft.com). |