Winter 2003/2004
Winter 2003/2004 |
|||||||
|
|
|||||||
U.S. Department of Agriculture Produces Objective and Accurate Global Assessments With GIS |
|||||
|
The GIS utilizes several different satellite data sources—climate data, crop models, and data extraction routines for yield and area estimates—to determine production (production = yield x area). FAS has a global network of attach�s who provide on-the-ground reports of observed crop and contextual information. Also, FAS regional analysts travel extensively in the countries they cover to more fully develop the context and constraints within which their assessments are made.
Other contextual information, such as official government reports and trade and news sources, plays a significant role in interpreting how these factors will affect price and policies and other econometric analyses. PECAD's final production estimate, produced by the 10th day of each month and cleared by the World Agricultural Outlook Board, is based on an all source convergence of evidence methodology. The final production estimates are used in a variety of ways including
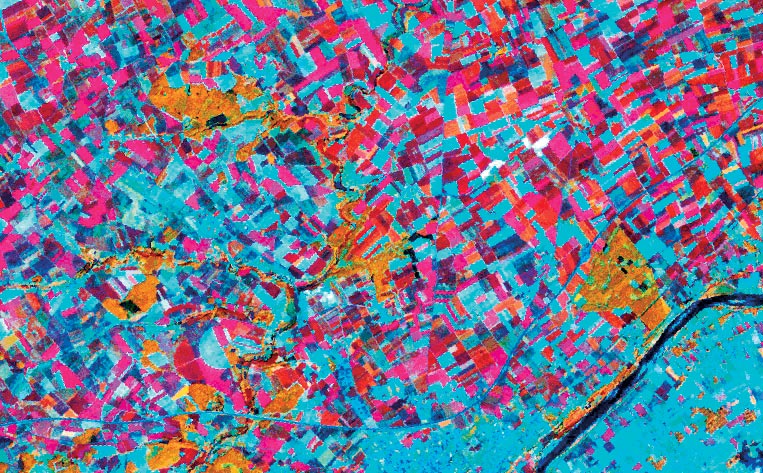
PECAD relies on remote sensing data from satellite sensors as an important source of data for its GIS reports. Selected data sets provide daily, weekly, and targeted coverage with resolutions ranging from one kilometer to less than one meter. The data is stored on a terabyte server accessible to each analyst's workstation. Because the USDA standardized with Esri GIS in 2001, TIFF and compressed MrSID images are used operationally with ArcGIS Desktop (ArcInfo, ArcView, and ArcEditor). The Crop Condition Data Retrieval and Evaluation (CADRE) database is the main decision support tool used in the GIS by PECAD analysts. CADRE is a global grid-based, geospatial database that stores daily, monthly, and decadal (10-day) data. The sources for this data are the Air Force Weather Agency (AFWA) of the U.S. Air Force and the World Meteorological Organization. PECAD takes this source data and models precipitation, temperature, soil moisture, and crop stages. To measure vegetative vigor, PECAD calculates vegetation index numbers (VINs) from satellite-derived data. The data is imported into one-eighth degree mesh grid cells and can be categorized in the following three manners:
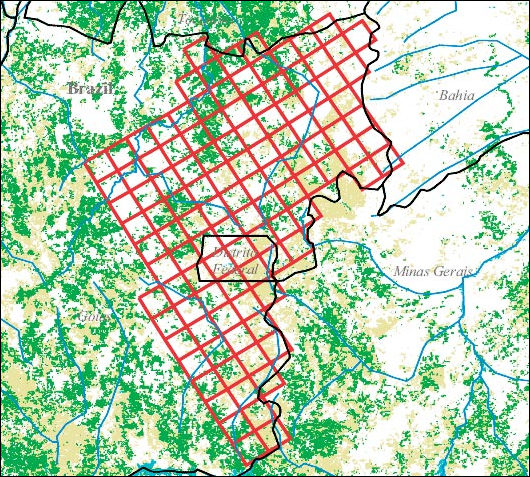
Time series data sets—Daily agrometeorological data derived from station and satellite data includes precipitation, minimum and maximum temperatures, snow depth, solar and long wave radiation, and potential and actual evapotranspiration. Daily and decadal VINs were derived from local area coverage (approximately 1.1 km pixels) and global area coverage (approximately 8 km pixels from the National Oceanic and Atmospheric Administration's advanced very high-resolution radiometer [AVHRR] satellite series). Normal baseline data sets—Normal precipitation, temperature, potential evaporation, and elevation values; soil water holding capacity based on the United Nations Food and Agriculture Organization's Digital Soil Map of the World at 1:5,000,000 scale; and decadal VIN normals or averages for the global area coverage data set. Crop information and models—Crop type and average start of season, average yield and area planted, percent crop production within a country, two-layer soil moisture algorithm, crop calendars based on growing degree days, crop stress or alarm models for corn and wheat based on soil moisture and temperature thresholds, crop water production functions to estimate relative yield reductions (yield reduction models), and crop stage models. ArcGIS is essential in managing the geospatial data from CADRE and the various other data sources used at PECAD. Much of the baseline data sets are stored as shapefiles on PECAD servers. The ArcMap application of ArcInfo is used to geographically combine the varied data sets in a visual assessment to determine a convergence of evidence analysis. Commodity production is then estimated from the yield and area parameterization. Although analysts have a disparate array of region specific data sources and crop growth models at their disposal, PECAD's GIS allows analysts to spend less time on repetitive analysis tasks and more time on utilizing all available data for the monthly crop production assessments. ArcIMS is being used by PECAD to automate these tasks and make data model results and ancillary data more accessible. The Crop Explorer Web application (www.pecad.fas.usda.gov/cropexplorer) features near real-time global crop condition information based on the satellite imagery and weather data processed by PECAD. The Web mapping application uses ColdFusion, Java, ArcIMS, SQL Server, and ArcSDE to manage and store the geospatial data. ArcSDE relationships are set up between PECAD "regions" and the various feature classes used by the maps (e.g., rivers, administrative boundaries). The Crop Explorer ArcIMS MapService is built using these same ArcSDE features. During a map generation request, the grid cell layer feature class is joined to the appropriate attribute data such as precipitation, soil moisture, or temperature. Thematic maps of major crop growing regions depict vegetative vigor, precipitation, temperature, and soil moisture. Time series charts depict growing season data for specific agrometeorological zones. Regional crop calendars and crop area maps are also available for selected regions. U.S. producers, traders, researchers, and the public can use Crop Explorer to visualize this information with a Web browser. Regional droughts or excessively wet conditions can be easily identified by the amount of ground surface greenness as depicted by the Normalized Difference Vegetation Index, a measure of vegetative vigor derived from AVHRR satellite imagery. In addition, daily satellite image composites originating from the National Aeronautics and Space Administration's MODIS Rapid Response System are now directly linked to selected agricultural regions within Crop Explorer at www.pecad.fas.usda.gov/cropexplorer. For more information, contact Bob Baldwin, USDA (e-mail: bob.baldwin@usda.gov). |
 The Production Estimates and Crop Assessment Division (PECAD) of the U.S. Department of Agriculture (USDA) Foreign Agricultural Service (FAS) is responsible for global crop condition assessments and estimates of area, yield, and production for grains, oilseeds, and cotton. The primary mission of PECAD is to produce the most objective and accurate assessment of the global agricultural production outlook and the conditions affecting food security in the world. Regional analysts use GIS to collect market intelligence and forecast reliable global production numbers for the grain, oilseed, and cotton crops.