Winter 2004/2005
Winter 2004/2005 |
|||||||
|
|
|||||||
2004 Presidential Election Coverage
CBS News Headlines GIS Mapping |
|||||
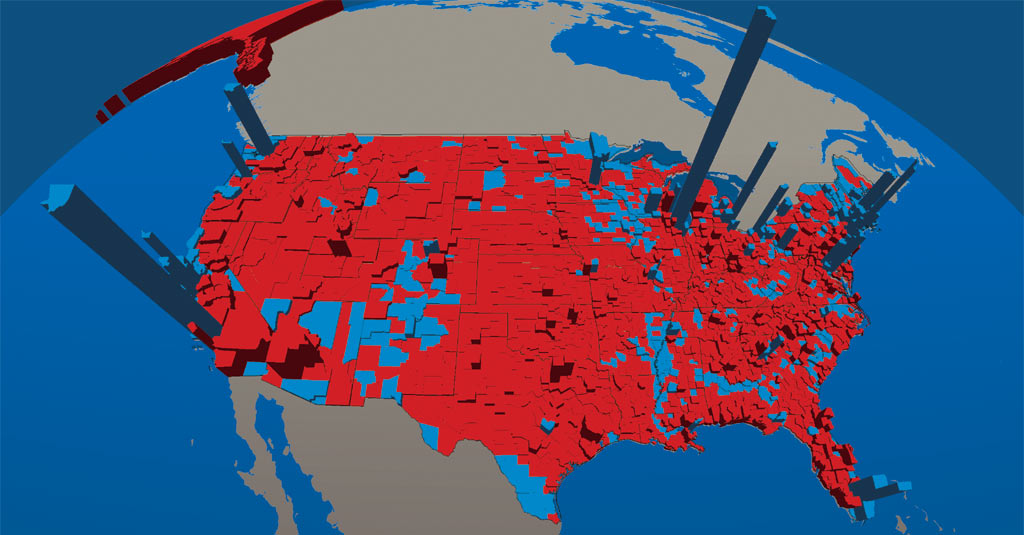
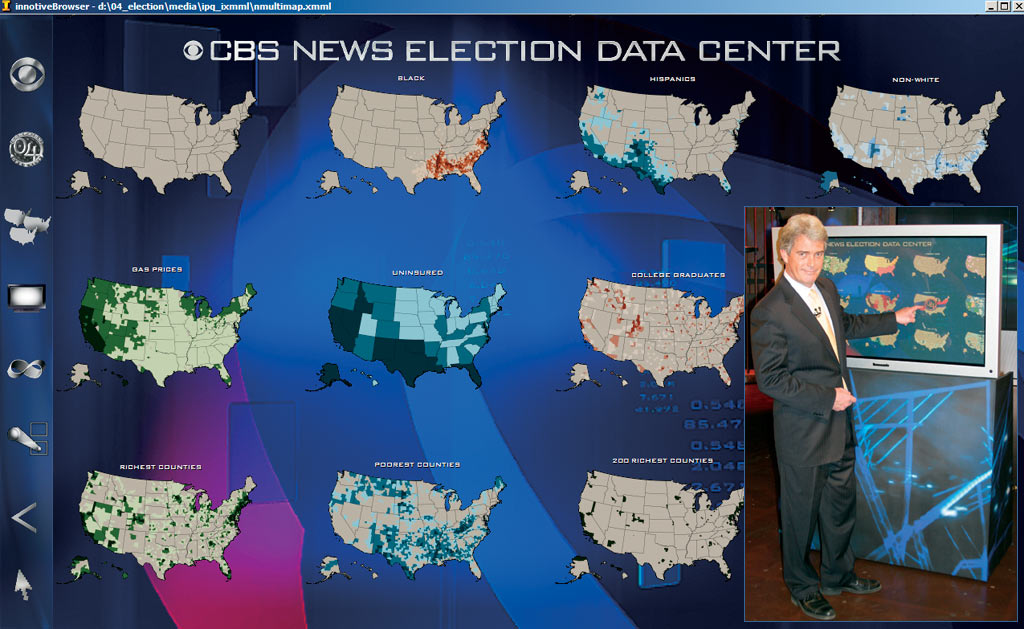
The power of GIS to tell stories and put information in context was demonstrated on election night, November 2, 2004, in the United States. CBS News used ArcGIS software to create and quickly update results maps for its coverage. The data driven maps provided the American public with a detailed look at voting patterns by county, while other maps showed the demographics of those counties. The advanced system allowed CBS News to show which presidential candidate was leading in each county around the country. The maps were updated continuously. Three-dimensional, county-level maps were created every five minutes, and other products were created on demand and synchronized with the news coverage. On election day, Esri staff worked in the studio with CBS News directors, producers, and correspondents to support the story of the election as it unfolded. "This was a landmark use of GIS for network broadcasting, and we're pleased with the results," says Dan Dubno, Emmy Award winning producer, technologist, and project lead for the CBS News election mapping project. "We worked with Esri for more than a year to create a system architecture that would transform many different data variables into useful, understandable information for a nationwide audience. We met the challenge of providing fact maps that could be updated in a fast, efficient manner." Chief White House correspondent John Roberts presented viewers with detailed digital maps based on demographic variables, such as race, income, and education, from his position at the CBS News Election Data Center. These different data sets gave insight into where certain groups are concentrated and how those areas voted in the presidential contest. On a touch screen display with multimedia content software from Innovative Solutions International Inc., Roberts could pan from one demographic map to another. He could also switch from 2D to 3D views of the county results. The 3D maps depicted the number of votes by which a candidate was leading his opponent. The results provided a qualitative leap forward in reporting on national voting patterns by CBS News and provided both a deeper analysis and more dynamic visual presentation. "We were honored to work together with CBS News in this very important endeavor to enhance the ability to present information-rich graphics as part of its 2004 election coverage," says Jack Dangermond, president of Esri. "CBS News is at the forefront of using computer mapping to enhance election coverage and visual presentation. Esri worked long and hard to provide CBS News with the visualizations and data presentations it was looking for. We look forward to a continuing relationship that will provide powerful reporting tools."
Previous CBS News election reporting provided electronic map-graphic displays at the state and county levels, but these displays were not linked to the voting results database. The 2004 presidential coverage by CBS provided a much finer resolution of voter pattern visualization directly from the votes database and helped better communicate the where, how, and why of voting results. "The GIS mapping and data system allowed us, for the first time, to show county-level election results integrated with demographic data using 3D digital maps," says Al Ortiz, executive producer and director, Special Events, CBS News. "The system enriched the presentation of results for our viewers." Esri used ArcGIS software to develop the CBS News election mapping capabilities. ArcGIS 3D Analyst (with ArcGlobe and ArcScene) and ArcGIS Engine were also used for various aspects of the CBS GIS solution. In addition to data collected by CBS News, the GIS used data products from Esri Business Information Solutions, including more than a dozen different demographic characteristics. "We prepared dozens of map layouts so that, on election night, data could be married with the map and output in minutes," says Kris Goodfellow, media industry manager, Esri. "As election results poured in and the maps were updated, CBS News could look at the results compared with various demographic and other variables that might be influencing voting patterns, such as where the most money was spent on advertising by the candidates. The different mapping techniques gave CBS News a variety of ways to communicate complex information more quickly and easily to a wide audience. These maps had to be clear to viewers within a matter of seconds, so the presentation had to be clean." For more information about how GIS software is used in elections, visit www.esri.com/elections. |