Winter 2004/2005
Winter 2004/2005 |
|||||||
|
|
|||||||
Dust Mapping in Arizona Uses GIS and Satellite Imagery |
|||||||||
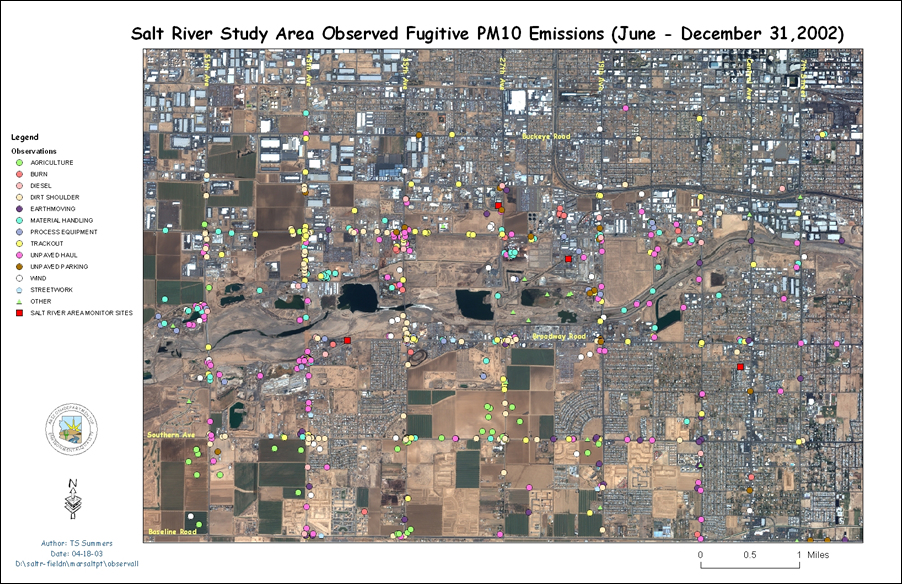
GIS is used to process and interpret satellite imagery and to produce valuable tools for environmental dust analysis. Increased resolution from improved satellite imagery, combined with GIS technological advancements, provides environmental managers with incredible geospatial research images. On-the-ground field crews, using mobile GIS technology, capture additional geographic data and perform inspections, dust inventories, and site verification, all of which are uploaded to the geospatial database. Maps produced with GIS can alert scientists to notify people residing in areas where hazardous dust is approaching to take precautions. Decision makers use environmental dust maps to implement dust control measures, such as vegetative covering, barrier methods, irrigation, and street sweepers. Dust is always in the air. Its quality and density depends on various factors, such as source, climate, and the direction and velocity of the wind. Today's high-resolution satellite imagery makes it easier than ever to identify dust source areas. Dust source points and the types of dust they generate can be displayed on a GIS map. GIS modeling and statistical analysis are useful for predicting the effects wind and climate have on moving dust into the air and how long certain particle types remain suspended in the air. Types of dust and dust toxicity levels can be color coded and depicted on a map. Arizona's desert environment creates dusty conditions. The Arizona Department of Environmental Quality (ADEQ) needed to find an accurate way to collect field geospatial data for air quality emission inventories. Tom Summers, ADEQ GIS project manager, began developing geospatial emission data in 1999. Since then, he has noted a marked improvement in satellite imagery and GIS technology that has made his data more accurate and more useful.
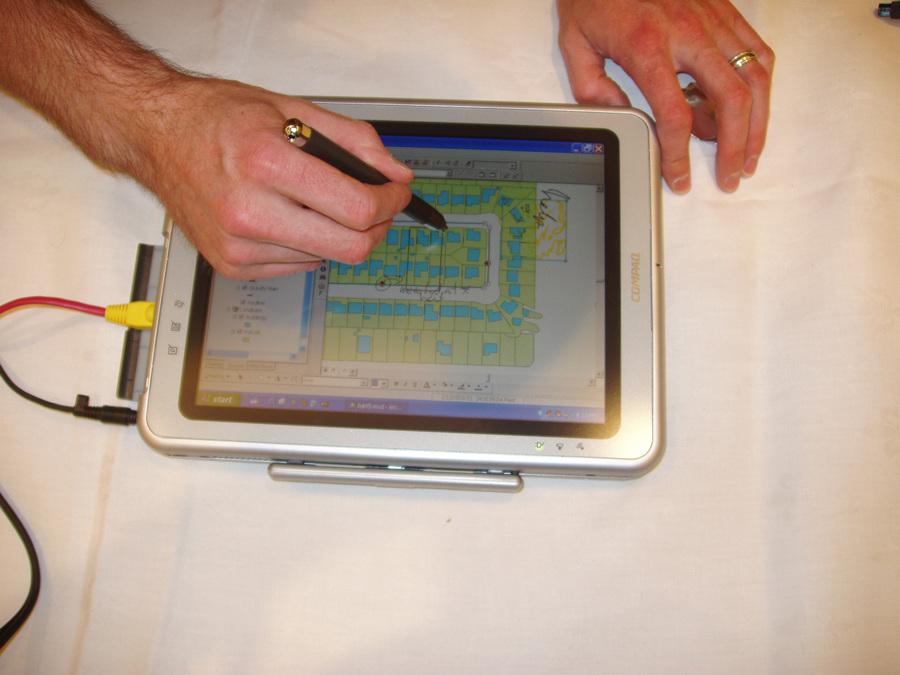
"Being able to put two components together to build a system to manage the environment," says Summers, "is the most powerful tool that we have to this day and for the next 10 years in the future." In the past, field-workers collected source-point data and wrote on paper maps to note what they found in the field. These on-site observations were later compiled in a spreadsheet for policy makers. In the early 1990s, Summers began to use satellite imagery with 30-meter Landsat or 25-meter SPOT data, which included 10-meter panchromatic black-and-white photos. The resolution was good for performing regional studies but not adequate for specific area studies. Aerial photos were useful but expensive. Summers explains, "If I was doing a study to analyze urban development and the residual environmental effects, the cost of aerial photography was too expensive. New images from IKONOS and more recently QuickBird satellites have made the satellite imagery more affordable and more useful." Today's satellite imagery is much improved. For example, QuickBird satellite imagery delivers resolution as high as 2.44 meters (8 feet) multispectral at nadir. At this level, the reader can easily see dirt roads, fields, and human activities that create dust particle matter that is less than 10 micrometers in size. Summers first used the high-resolution satellite imagery along the Arizona-Mexico border in Douglass, Arizona, and Agua Prieta, Mexico, the fastest growing city in Mexico. He found satellite data had many more advantages than aerial photography. It is less expensive, is clearer, delivers images over borders without legal barriers that airplane imagery faces, and is easily put into the same projection system used by the state of Arizona. Next, the data is indexed. Summers describes his indexing method, "First I grid the images, which has two benefits: (1) The procedure gives me an index, so people in the field can be on the same page with the people who are taking the information off the images in the office. (2) Grid maps can be used in a model." Modeling uses a specific grid size and takes information off that grid and relates it to a number of certain types of activities. Originally these maps were printed on paper; now they are input onto field-workers' Tablet PCs. Once a coverage is digitized, the user engages GIS to attribute the coverage according to land use activities. The modeling grid is placed on top of the coverage, and the two are merged. With ArcGIS Desktop (ArcInfo and ArcEditor), instead of having one coverage of various land uses, you can set the grid up to show the percentage of land area within a grid that has a certain activity.
Edited data is then entered into ArcGIS Desktop, which is used for digitizing polygons on the space imagery. Creating the polygons and color coding them according to land use and land characteristics make the maps very useful in the field. The Environmental Protection Agency (EPA) has inventory codes for specific land uses. Using these numbers, we code, for example, agricultural lands as 42 in the inventory database. ArcGIS Desktop uses the database table to create a polygon that shows that code's particular land use. EPA has scientific models for evaluating certain types of land use and emission factors. These factors are added to the ADEQ model and run. Prior to mobile GIS, field-workers marked up paper maps and brought them back into the office where the information was digitized into ArcInfo. This transfer of data from hand notes to the computer was the longest step in the process. Tablet PCs are reducing this process greatly. Rather than printing a map, the digitized coverage is downloaded to the Tablet PC and the field-worker uses ArcEditor to enter field data. All the shapefiles created for a project are on the field computer. ArcEditor allows the field-worker to digitize on the shapefile. "We first create the coverages in ArcGIS Desktop," explains Summers. "Next, we set up the basemap using the imagery and boundaries of the study area, and we add the grid map and download it to the Tablet PC. The field people take the Tablet PCs into the field and digitize the files." A GIS-enabled Tablet PC enables the user to interact with the map using a digital pen. Field-workers can draw a circle on the map for zooming. Digital ink functionality allows the user to quickly navigate and mark up a GIS map. Field-workers are adding to the database and attributing while actually in the field. In addition, they have the ability to add GPS information as a cross-reference of the satellite imagery, thereby enhancing data quality assurance. By adding graphical user interfaces (GUI) on the Tablet PC applications, the task is made easier for field-workers and training time is reduced. For example, with a button-activated GUI menu, the user simply pushes a button and the map sets up. The worker uses the digital pen to enter polygon information for a redline layer. With the push of another button, the attribute list opens. The attributes are immediately available for selection. The captured data, whether from the GPS, inventory list, or digital notation, is entered into a data file or shapefile. The worker brings the mobile computer back to the office and uploads the information into the main system's geodatabase.
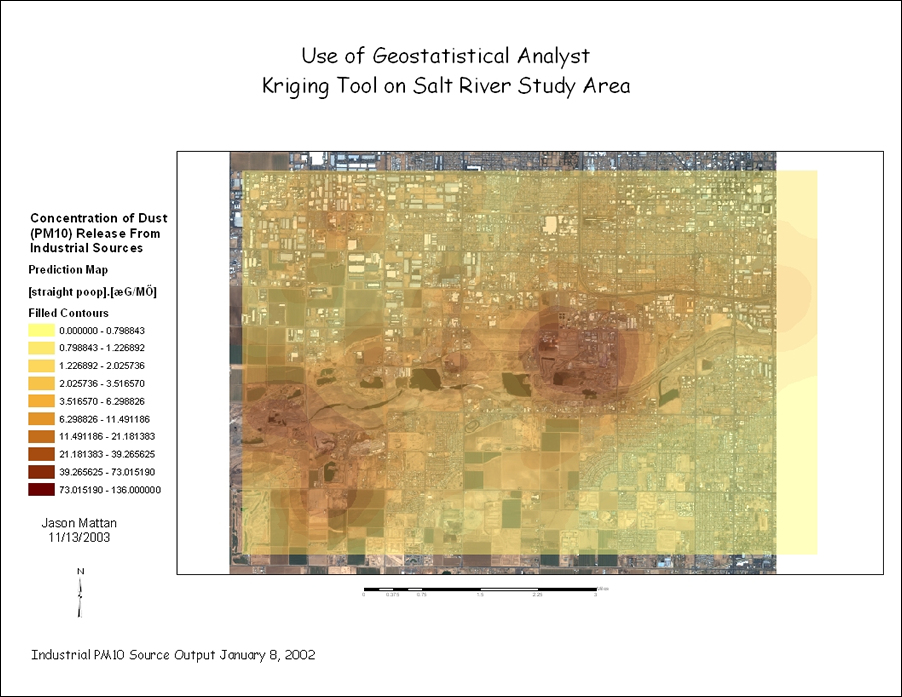
In the office, the GIS manager reviews and edits the shapefile for dangles or extraneous polygon information for the coverage. Once the coverage is cleaned up and ready, the grid is once again laid on top and the field information is added to the model. GIS-enabled Tablet PCs speed up the database editing process and provide more accurate data for modeling. The high-quality geospatial database can be accessed for complex manipulation; for example, data can be further explored using the ArcGIS Geostatistical Analyst extension to identify anomalies, perform prediction, evaluate uncertainty, and create surfaces. After years of experience monitoring the environment using geospatial technology, Summers has learned some lessons. "Most people are overly concerned about costs, but they cannot afford to be. It is going to cost them more in the long run if they scrimp in the short run. Another key is to carefully listen to other people's insights because everyone on the team has experiences they can add to the project. A cooperative environment makes the project easier and more exciting, and the outcome is a better product." Summers says, "Effective environmental practice considers the whole spectrum of the environment. ArcGIS technology offers a wide variety of analysis tools to meet the needs of many people. It prepares information for managers, politicians, and others to help them make better decisions about the environment." For more information, contact Tom Summers, Arizona Department of Environmental Quality (e-mail: Summers.Tom@azdeq.gov). |