Winter 2004/2005
Winter 2004/2005 |
|||||||
|
|
|||||||
In Uganda, HIV/AIDS Activities Are Monitored With GIS |
|||||
|
By the Uganda AIDS Commission Uganda is a relatively small country lying in the heart of Africa just above the equator. It has a population of approximately 24 million people, the majority residing in the southern part of the country. Its capital city is Kampala.
AIDS arrived in Uganda in 1982 when a mysterious disease affected a couple of fishermen at a landing site on Lake Victoria in the Rakai district in southwestern Uganda. In the early 1990s, the prevalence rate was approximately 18 percent; it has since dropped to 6 percent. AIDS is the leading cause of death among the population between 15 and 49 years of age. Many international donors are responding to HIV/AIDS in Uganda through material and financial support. More than 1,000 organizations are currently active in HIV/AIDS activities in Uganda—ranging from international funded projects operating in several districts in the country to small, local nongovernment organizations located in the field and operating at a local level. The Uganda AIDS Commission"The Uganda AIDS Commission (UAC) is the coordinating body for all HIV/AIDS activities carried out in Uganda," says the director general of the commission, Dr. David Kihumuro Apuuli. "It has, therefore, developed a national monitoring and evaluation framework in Uganda to measure and evaluate the progress—the National Strategic Framework (NSF) on HIV/AIDS." Besides this, UAC and its monitoring and evaluation (M&E) unit are performing tasks to
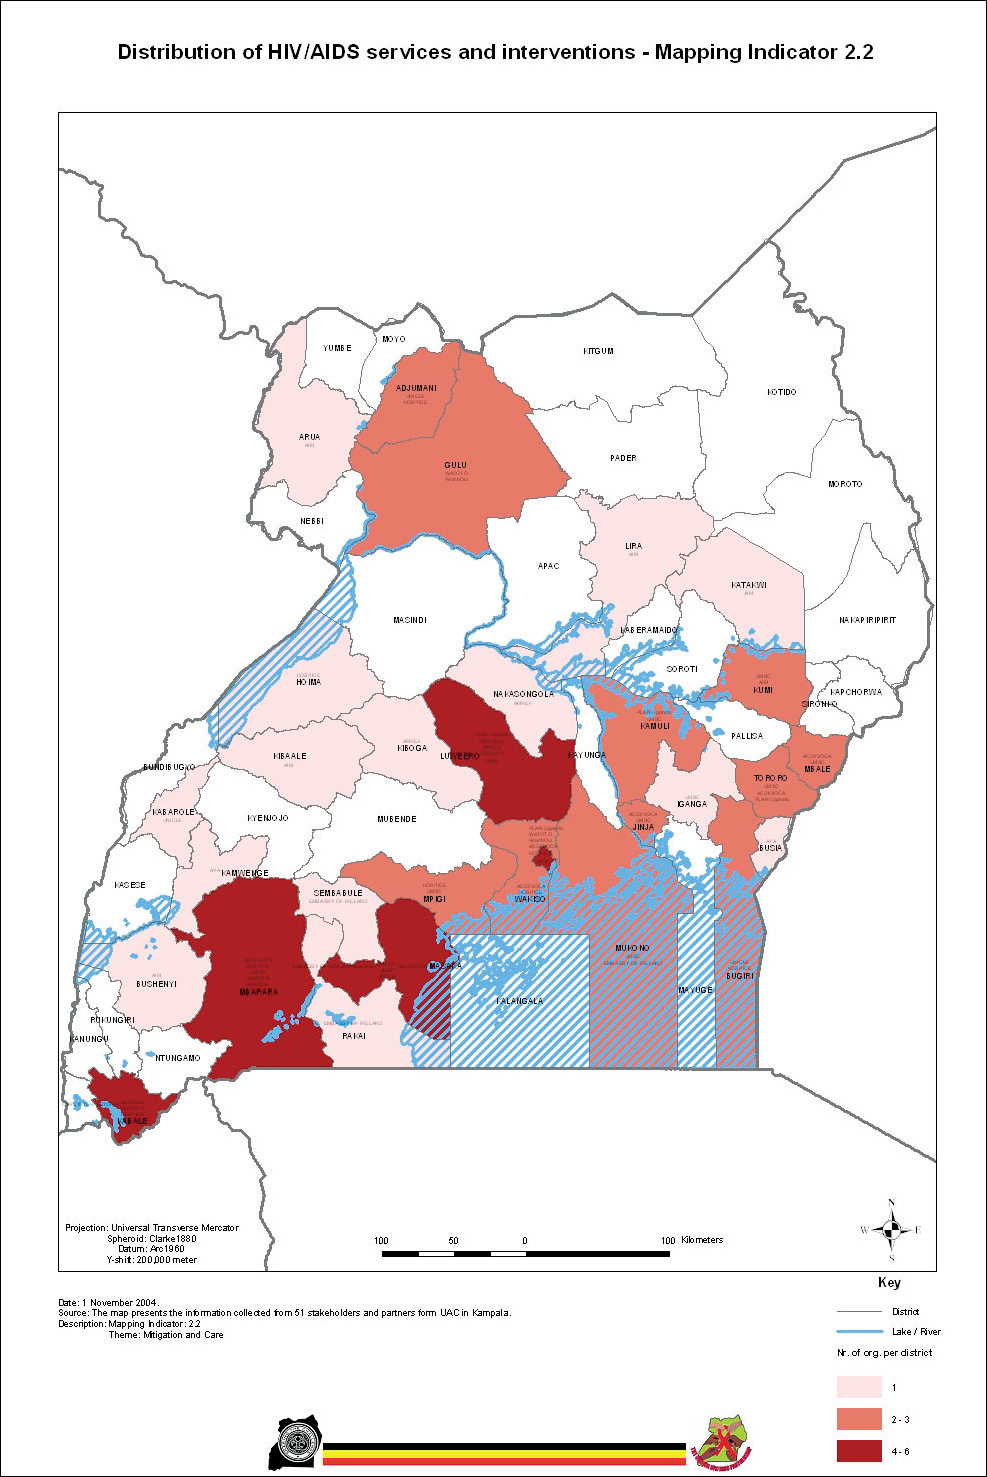
The M&E framework provides national- and district-level core indicators with its benchmark data and targets for each reporting period. Introduction of GIS in Monitoring HIV/AIDS InterventionsThe midterm review of the National Strategic Framework that was carried out in 2003 identified the lack of comprehensive information on HIV/AIDS intervention and service coverage within Uganda. Currently, information on what services are being provided where (geographic coverage), to whom (beneficiary), and by whom (organization) and the level of beneficiary coverage is lacking. As a follow-up on his earlier statement on M&E, Apuuli says, "Without this information, the actual gaps at programmatic, geographic, and financial levels cannot be determined." To solve this shortcoming, UAC has proposed to build a database and carry out a mapping exercise to capture the current services and interventions on HIV/AIDS in Uganda by using a GIS system. Apuuli also added that "the Commission is grateful to the Agency for International Development for supporting this project." Thematic Mapping and Geographic AnalysisA Feasibility Study (Phase I) was conducted in June/July 2004 to identify possible data sources for the mapping exercise. During Phase I, the NSF and M&E framework indicators were evaluated, and a set of mapping indicators was identified based on and derived from the following themes and interventions indicated in the M&E framework:
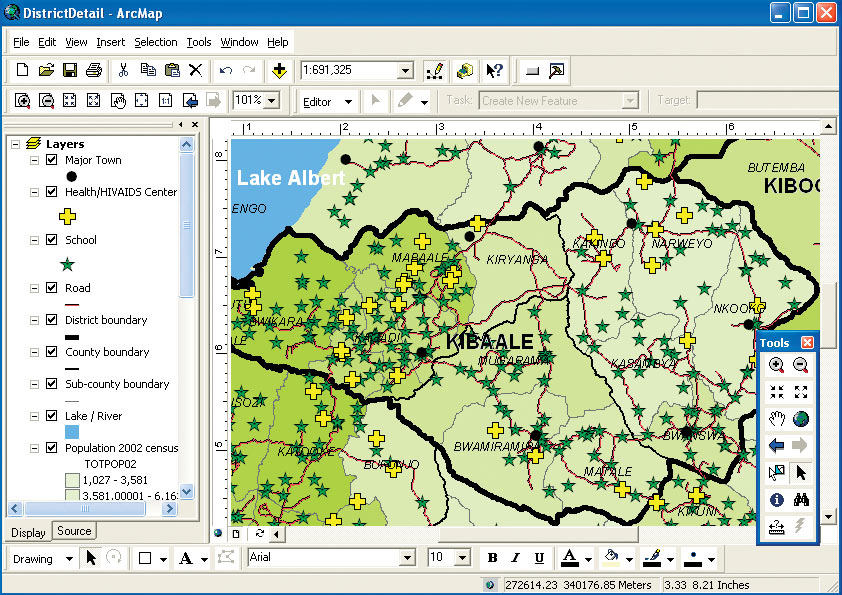
After a thorough survey during Phase I on the type of GIS systems currently used in Uganda, it was decided to carry out the mapping exercise with ArcView 9—the most commonly used GIS software in Uganda. The database was designed using Microsoft SQL Server 2000 Desktop Engine as the database management system and Access 2002 as the graphical user interface (GUI) supported by Visual Basic for Applications. A special UAC toolbar has been developed, which opens the database to generate the data that has to be mapped through a GUI. An object linking and embedding database (OLE DB) connection made within the ArcView application's ArcCatalog retrieves the information from the database. During Phase II, data was collected from stakeholders and partners of UAC, and ArcView application's ArcMap was used to transform this information into a variety of thematic maps showing
To scale up HIV/AIDS interventions, detailed information is required at the subdistrict (also called subcounty) level. Phase III (October-December 2004) of the project collected more information at the subcounty level, especially on beneficiary coverage and location and activities of local organizations. The information presented above is from a district point of view. The database is flexible and can also be queried from an organization point of view (e.g., Where is the World Food Programme of the United Nations active and in which intervention areas?). "The mapping tool on HIV/AIDS interventions in Uganda has already proven to be very effective. Before, we were always presenting our information in table form," states Dr. Jim Arinaitwe, M&E advisor at the Uganda AIDS Commission. "Now, we can add a new dimension to this, and we are in a better position to analyze the current situation on service provision in the country. We are all looking forward to receiving the district information and going one level deeper into analysis of our situation." Training UAC Staff in GISThis was the first time that GIS was used at the Uganda AIDS Commission and, therefore, six staff members were trained in ArcView 9. "This is a new technology for all of us," says Elizabeth Mushabe, Partnership Development officer in the commission. "We received two weeks' training, starting from the introduction to ArcView to thematic mapping." For more information, contact the Uganda AIDS Commission (e-mail: uac@uac.go.ug) or Sjaak Dieleman (e-mail: diewee@africaonline.co.ug). |