Winter 2004/2005
Winter 2004/2005 |
|||||||
|
|
|||||||
In Wisconsin, Using GIS Gets the Vote Out |
|||
|
In an election year that saw unprecedented but still sporadic use of GIS in political campaigns, one such effort involved a major contribution to the Get Out the Vote (GOTV) effort in the state of Wisconsin.
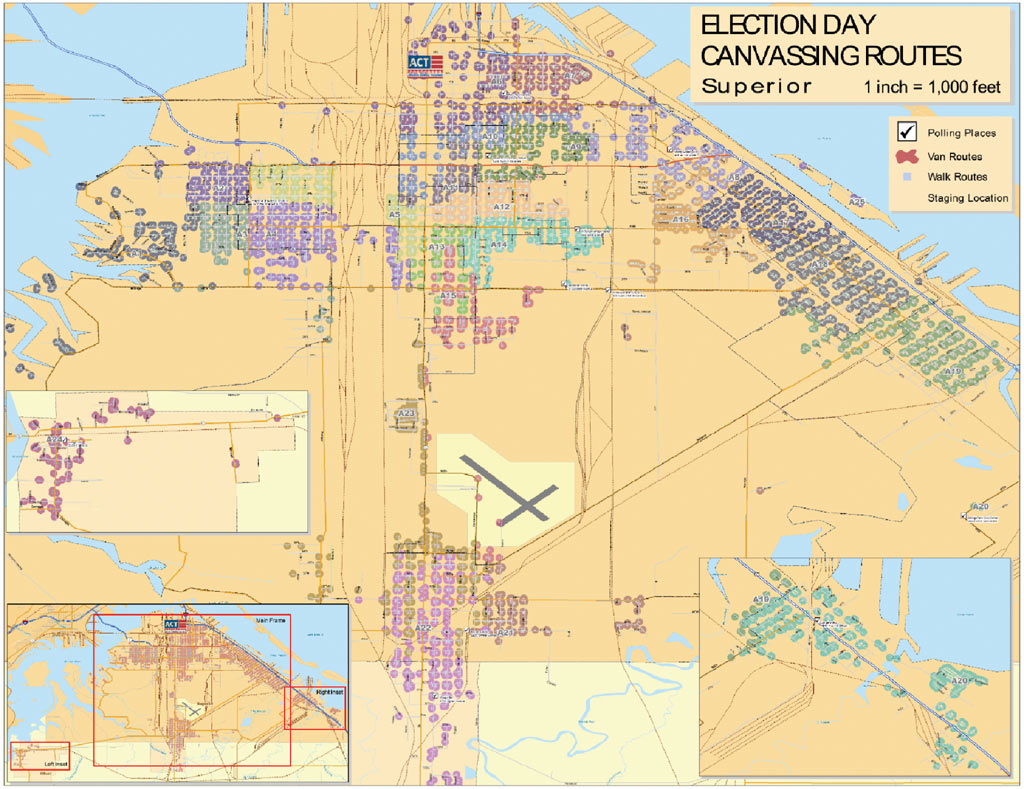
Map the Vote, LLC, grew out of a network of GIS professionals in California's San Francisco Bay area dedicated to matching GIS skills to the needs of progressive electoral efforts. Following several months of application development and a list of enhancement projects, the organization turned to help the final GOTV stage of the campaign. America Coming Together (ACT), the largest of "527" (named after a section of the tax code) organizations that carried out the "ground war" in 2004's United States presidential election, had more than 5,000 people organized to perform GOTV operations in the state of Wisconsin. Its primary job in the closing weeks of the campaign was to physically contact and motivate hundreds of thousands of carefully selected voters whose sympathies were clear but whose likelihood of voting was in doubt. Arriving in Wisconsin to work with ACT in mid-October 2004, Patrick DeTemple, president of Map the Vote, found a team that was deeply concerned about the quality of the data upon which the entire operation would rest. At issue in particular was the spatial attribution of the correct voting ward/precinct to each voter. After two days of discussing the strengths and weaknesses of using GIS tools to solve the problem, the ACT staff decided to throw out the old data attributes and rely entirely on a process that began with the street centerline geocoding of millions of voter records. "The ACT staff was very smart and very young," recalls DeTemple, "and the decision to introduce brand new, mission critical methods three weeks from the election took a lot of nerve." Map the Vote had decided to standardize on ArcView software because of its versatility, familiarity, and range of extensions and because the anticipated GIS volunteers would be more likely to have been trained in ArcView than in any other product. Using the StreetMap extension for ArcView, 4.6 million voters in the state of Wisconsin were geocoded and then associated with the appropriate election district (ward). Next, using the ArcView map book extension, the GIS team produced thousands of ward maps to assist route designers in the creation of individual "walk routes." Once the routes were completed, more than 2,100 unique maps showing the location of each geocoded household were prepared and distributed to the GOTV canvassing teams. These two- and three-person teams were to be dropped off by vans carrying anywhere from six to 12 people, so the GIS group turned to the creation of van routes. With too little time to take full advantage of the routing capabilities of the software, the individual households on a route were simply dissolved to multipoint objects that were then selected and grouped in logical patterns by a routing team into new multipoint objects representing the households on the van route. Using the ArcView application ArcMap, these objects were then buffered and the buffers rendered semitransparent to provide easy identification of the route. This enabled ACT to provide all of the more than 500 van drivers with a route map indicating their route, the routes of their individual walking teams, and recommended drop-off points (a byproduct of the ArcView application ArcToolbox "dissolve" function applied to the walk routes) for each team. The final mapping product consisted of large format wall maps for each of the staging areas throughout the state showing the van routes, walk routes, and polling places within their area of responsibility. "Polling places were a major task," says Jason Hochshild, a Wisconsin ACT/GIS volunteer. "We realized that, since no statewide list existed, most data needed to come directly from the local jurisdiction, and we had to create a statewide polling place database from scratch." This concern for data quality permeated the operation. "With the last minute decision to rely so heavily on GIS," says Karin Tuxin, a Berkeley, California-based volunteer, "we were desperately concerned that some last minute quality issue would emerge and we wouldn't have time to fix it." In the end, the entire ACT GOTV operation unfolded smoothly in Wisconsin with no significant data quality issues. The time that elapsed between the initial decision to use GIS tools to the creation of routes and map distribution to more than 5,000 people was less than 14 days. "I was surprised at how quickly and effectively the GIS tools cleaned up our data and lightened our workload," says Clayton Nall, deputy director for Data and Targeting for Wisconsin ACT. "Compared with our previous efforts, route creation and map production were much less labor intensive." On election day, John Kerry won Wisconsin by fewer than 12,000 votes. In addition to the core value of providing the correct ward identifier for each target voter, the value added by the GIS functionality included
"The most gratifying moment for me came when one of the field organizers introduced himself to me on election day saying," says DeTemple, " 'You have no idea how many hundreds of hours you saved us with those walk maps.' That kind of validation at the ground level is the real measure of whether you're really helping out." For more information, contact Patrick DeTemple (e-mail: pdetemple@mapthevote.org). |