Winter 2005/2006
Winter 2005/2006 |
|||||||
|
|
|||||||
ArcGIS 9.2 Provides a Full Solution
Putting the "Art" Back into Cartography |
|||||||||||||||||||||||||||||||||||||||||||||
|
Cartography has been defined as the art, science, technology, and craft of making maps and is a discipline going back 30,000 years to cave paintings locating woolly mammoths. Maps have often been works of art, but also visualize the results of scientific and historical analysis. There is a large bank of accumulated cartographic wisdom describing how to make clear maps that convey the intended message.
From a cartographic perspective, GIS has great strengths in database-driven symbology, multipurpose mapping, and integrated query and analysis, but map publishers also need rich graphical representation and artistic freedom. So, a set of major software advances in cartographic functionality is under way for ArcGIS 9.2 that will facilitate and automate high-quality cartographic production while empowering the human cartographer with more creative flexibility. The aim of this update is to provide the optimal tools and environment for the production cartographer, centered on the rigor of the geodatabase. A key aspect is to automate as much as possible but then allow cartographic freedom where needed. The system will release mapmakers from repetitive manual operations and free them to concentrate on applying their unique human visual abilities for design and interpretation. The target user is the production cartographer, but many of the facilities will be of great benefit to the GIS user who simply wants to make a better map. IntroductionAlmost all commercial cartographic publishers today use GIS for the preparation of their data, and many do complete map production within the GIS. Other publishers rely on file-based graphics software, such as Adobe Illustrator, to create the final visual product and carry out cartographic edits. This split workflow has a number of drawbacks, in that it requires export then import between packages and lacks a consistent user interface. Duplicating changes and updates in both environments is inefficient and expensive. Feature attributes are unavailable during finishing, and there is a need to maintain separate databases to make multiple products at different scales. In addition, many national mapping agencies and commercial mapping companies have a strategic goal of using a common database and common environment for all map publishing and a capture-once-and-use-many-times ethos. This requires that it be
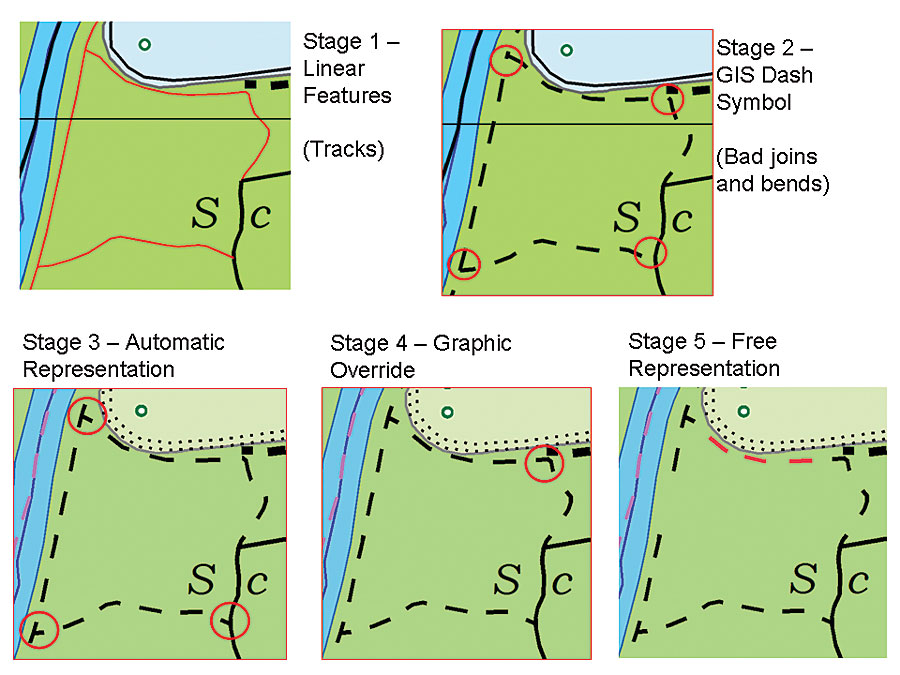
The new cartographic representation and override capabilities coming in ArcGIS 9.2 will support the complete cartographic production process within the GIS. Outputs include plot files for direct printing, image formats for Web or graphics publishing, and Adobe Acrobat PDF files for imposition, separation, and manipulation by prepress software. Representations and OverridesCartographers have always had difficulty in resolving the conflicting pressures of automation (rule-driven visualization) with those of cartographic clarity (freedom of expression). The new representations and override system in ArcGIS 9.2 unifies automation and freedom capabilities and resolves many of these problems. A small amount of information is added to geographic feature classes in a geodatabase to store representation rules and graphic overrides for individual features. Line ExampleRepresenting linear features unambiguously with patterned or dashed lines has traditionally been a challenging problem for cartographers. ArcGIS 9.2 provides a new solution to this and similar problems by supporting high-quality automatic representation of GIS features, while at the same time providing the flexibility to override the automated rules. Clear and attractive maps can thereby be efficiently produced. Figure 1 (above) shows five stages of symbolization for linear road or "track" features from a vector topographic GIS dataset (data copyright swisstopo). Traditional GIS-based mapping systems support only the first two stages. In stage 1, default GIS symbology (a red line) is assigned to the linear features, and in stage 2, a dashed line symbol is applied, as this is the typical line pattern used in cartographic products for tracks. This GIS symbolization falls short of many cartographic requirements because the poorly symbolized line intersections and bends (highlighted by the red circles) lead to ambiguity as to where the tracks start and end. Stage 3 shows how the new representation capabilities can automatically produce better symbology at line intersections by adjusting the line dash pattern to ensure intentional (half-dash) connections at the ends of all such line features. Stage 4 shows how the cartographer using this improved representation as a starting point can further perfect it by forcing the center of a dash to be placed at the sharp bend in the track in the northeast corner. This modification is stored in the database as an override to the representation geometry. Stage 5 shows the ultimate graphic freedom from the rules, where the cartographer has decided to change the color of some of the dashes and delete one dash from the other track. However, this "free representation" is still closely associated with the original feature. Representation StoragePhysically, a cartographic representation adds two additional columns to a standard ArcGIS feature class table within the spatial database. The source feature class stores point, line, or polygon geometries, as well as a set of additional attribute columns used for mapping, analysis, and data management. The cartographic representation columns store data that defines the representation rule used to symbolize a feature. They also store cartographic overrides, which are exceptions to the representation rule for a given feature. A representation system design premise was to avoid unnecessary duplication of data. Therefore, the extra columns that hold cartographic representations and overrides are minimal in size, and wherever possible, the representation information is derived dynamically from the existing GIS feature as it is needed. The structures used to hold overrides are flexible enough not to require separate columns for individual overrides. Representation RulesEach cartographic representation added to a feature class can refer to different rules for subsets of features within the feature class. For example, a roads feature class will typically have different rules for streets; first-, second-, and third-class highways; and freeways. It may also have variant rules for highways on bridges or in tunnels or for unique circumstances not normally part of the standard data model, such as a highway temporarily interrupted by a fair.
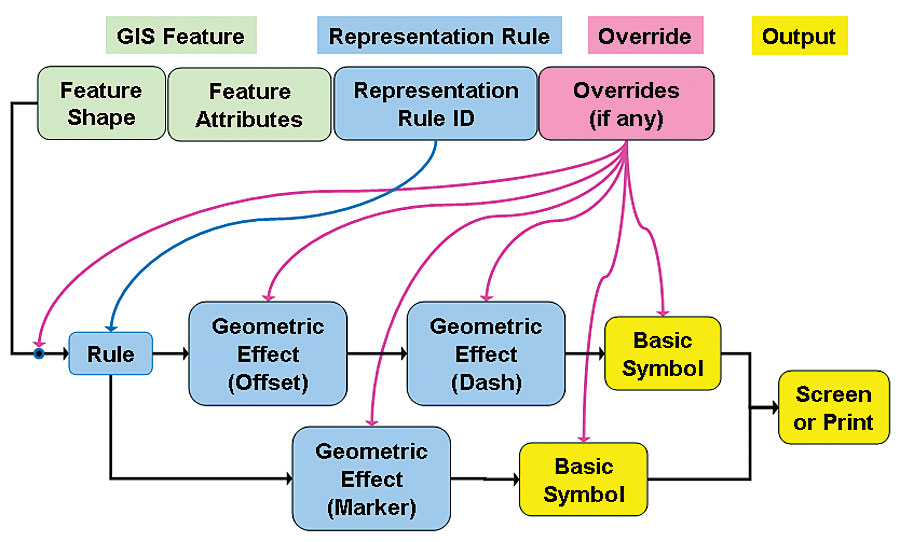
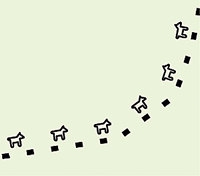
Rules are made up of one or more visual layers, each of which starts from the feature shape geometry and has an optional chain of geometric effects and placement styles that are applied dynamically prior to rendering with a basic symbol (marker, stroke, or fill). Figure 2 shows the data flows during symbolization of a cartographic representation added to a GIS line feature. The shape field of the feature has a representation rule applied, which generates two visual layers, the first of which goes through two geometric effects (an offset to one side, then a dash pattern) before having a basic symbol (stroke) applied. The second layer has one effect applied (a marker placement pattern) before the basic symbol (animal marker) is applied. Figure 3 shows a typical visual result of such a rule.
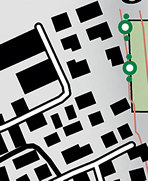
Rules can also be set up to use any existing field in the database as an explicit representation field to control the feature representation appearance. Such field values can be set by geoprocessing processes, which can use the full power of the GIS toolkit to determine the need and calculate the required result. A typical and powerful example is the use of the topology engine from within a geoprocessing tool to find all the cul-de-sac roads and set a database field, which is then used to control their line end style to be square rather than round (figure 4). Exceptions to Rules—OverridesOverrides allow the user to change the values used by the rules for an individual feature. In figure 2, the override field can modify the input shape, the properties of the geometric effects, or any of the graphic properties of the symbols.
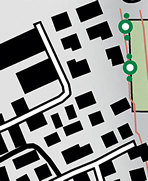
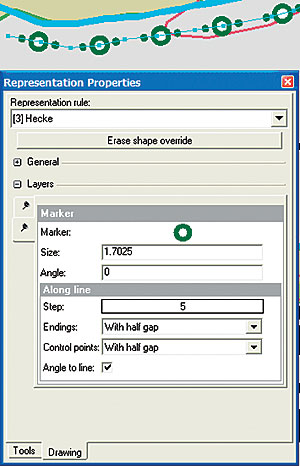
A set of intuitive geometric and representation property-editing tools is provided for defining and modifying overrides, based on tools and palettes familiar to a user of desktop graphics packages (figures 5 and 6). Figure 5 is the representation properties palette for a hedge line representation, using a pair of alternating symbols. It shows the range of graphic properties that can be overridden. Free RepresentationsA further level of exception is provided by the ability to convert any representation into a free representation. This makes an inline copy of the rules affecting the particular representation so that the rules can be changed for this one feature. This can include a change of geometry type (e.g., area to point), the addition of new rules or symbol layers, or the introduction of arbitrary new graphics. Being able to extend the data model in this way gives freedom to successfully represent features with appearances too rich to model otherwise, such as a railway siding area where the representation should just show a typified subset of lines indicating that "there are many railway lines here." It also allows repositioning or suppression of individual graphic elements of the symbolization, such as individual dashes of a road tunnel to avoid important features at ground level, as in figures 7a and 7b.
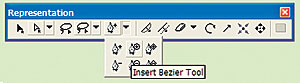
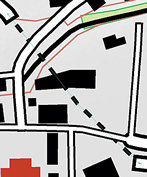
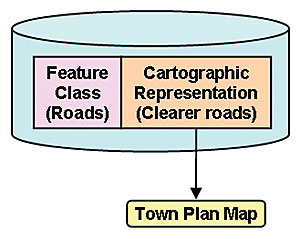
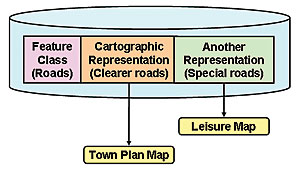
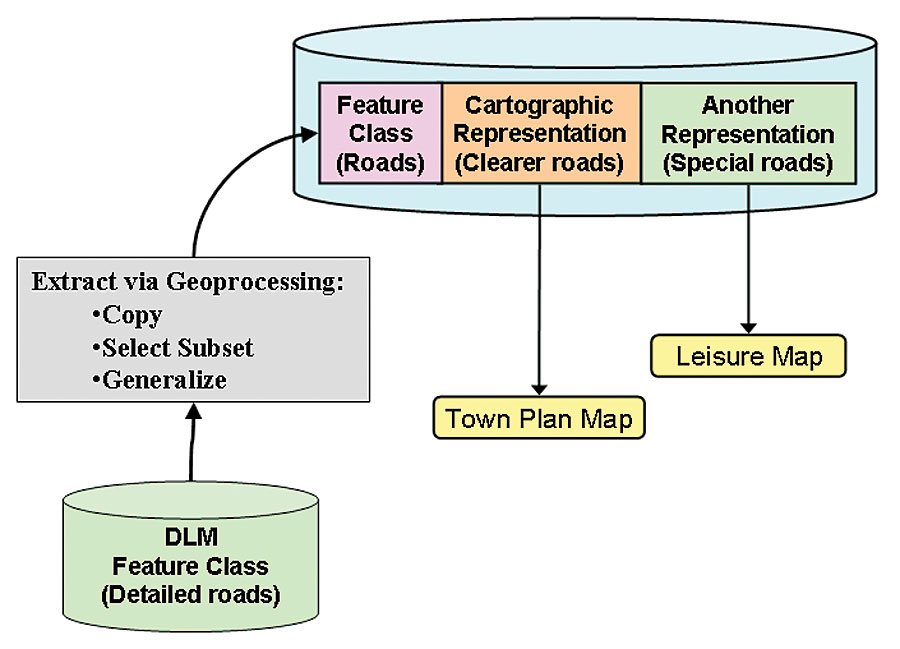
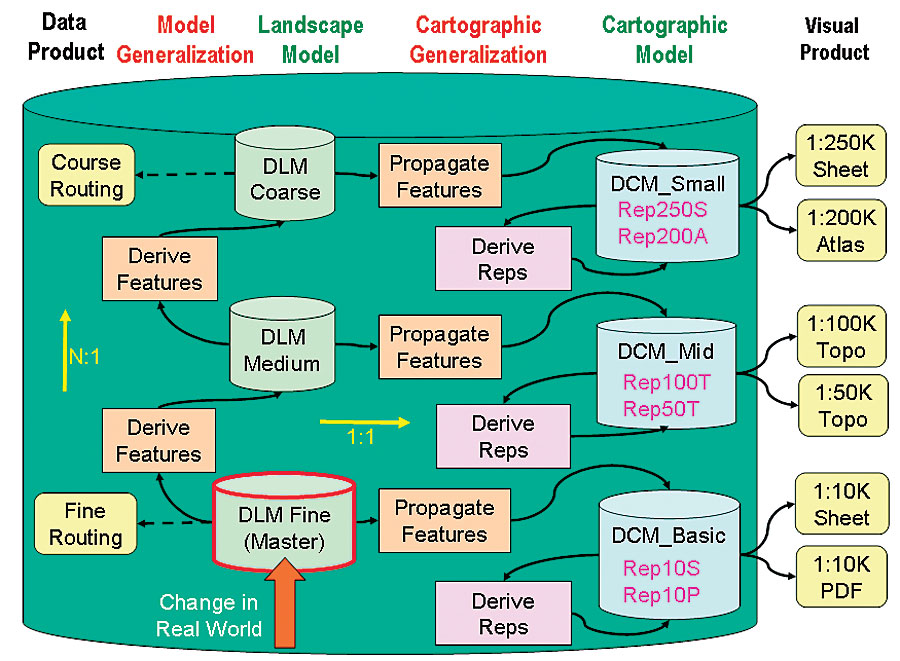
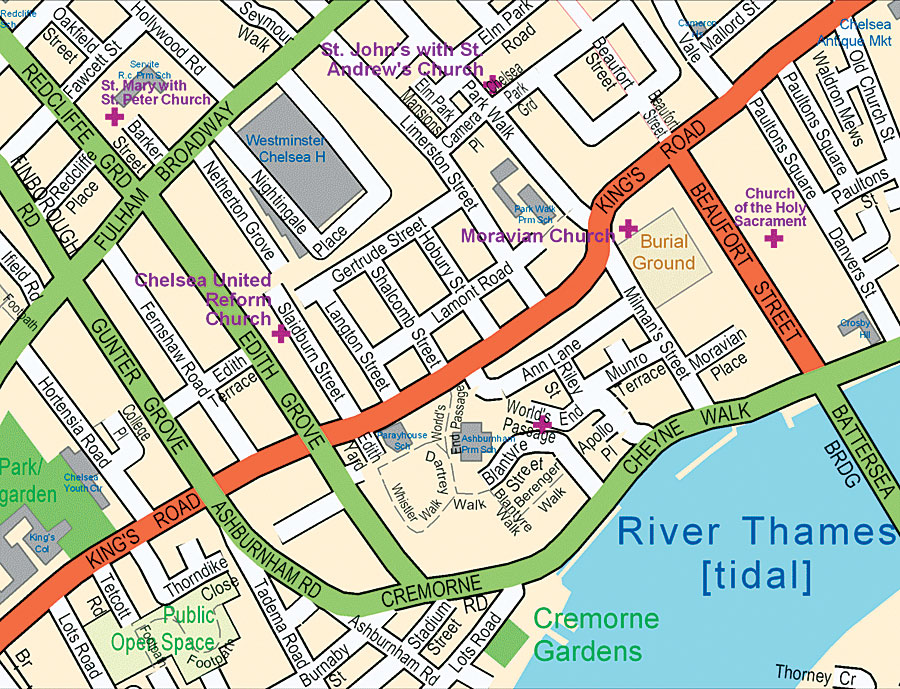
Cartographic Editing ToolsThe introduction of focused cartographic representation editing tools (figure 6) allows cartographers who currently prefer to use graphic software to work even more efficiently in a GIS-based environment. For example, representation editing tools work similarly to tools found in common desktop graphic packages. Furthermore, many of the newly introduced tools are particularly efficient because they are designed with specific cartographic tasks in mind. Editing of representations takes place within the same versioned editing environment supported by ArcGIS for editing vector feature classes so users have undo/redo capabilities available. Cartographic Data Models and WorkflowsThe workflow and data model best suited for cartographic production will vary considerably between organizations. The following sections outline different cases covering increasing levels of complexity. Simple workflow case—In the simplest case, an organization has existing GIS data in a feature class and wants to use it to produce a high-quality cartographic product. In this case, it adds a cartographic representation to the feature class (figure 8). Multiproduct case—In the next case, an organization has existing GIS data in a feature class and wants to use it to produce more than one high-quality cartographic product at similar scales. In this case, it adds a cartographic representation for each product to the single feature class (figure 9). Landscape and cartographic case—In the third case, an organization has a master database that is maintained to be true-to-ground and wants to use it to produce cartographic and noncartographic products (such as navigation routes for an in-car voice guidance system). We refer to this master as a digital landscape model (DLM). For cartographic production, the organization requires the extraction of requisite data from the DLM by selection and generalization into a digital cartographic model (DCM), which can then be enhanced with multiple representation capabilities as in the multiproduct case (figure 10). Enterprise strategy case—Figure 11 gives an outline of a future large-enterprise workflow that extends the DLM/DCM case to where multiple products of different types at different scales are to be produced dynamically. Here, the data flow must encompass both model generalization (deriving landscape model features at coarser resolution by selection, aggregation, and simplification), and cartographic generalization (deriving visually appropriate features by applying displacement, exaggeration, and typification), taking into account the symbolization widths and sizes. Such automated and incremental generalization is challenging, but Esri is working on providing appropriate tools within the ArcGIS geoprocessing framework. Once cartographic data appropriate to the scale band has been derived, then the multiple representation and override capabilities can be applied. These handle the symbology requirements and geometric differences for the product specifications needed to produce the various products. Cartographic EnvironmentThe cartographic representation and override capabilities described above fit into the rich and powerful ArcGIS environment, and cartographers can take advantage of GIS capabilities for topology, geoprocessing (e.g., generalization), layout, 3D, etc. The market-leading Maplex text placement application has been reengineered and built into ArcGIS as a label placement engine (figure 12). This can greatly reduce the previously labor-intensive task of generating and positioning text for cartographic clarity. In 9.2, there are substantial improvements to labeling and leader placement, and development will continue on specialist labeling strategies, such as contour laddering. Cartographers can also take advantage of other extensions and layered products in the Esri software suite. In particular, the Production Line Tool Set (PLTS) provides a software layer on top of ArcGIS to automate and optimize the cartographic workflow and the daily tasks of operators. It provides a set of interactive toolbars and automated processes targeted directly at cartographic production. PLTS, using the underlying geodatabase, provides facilities for defining a map series, then generates the map sheets automatically with appropriate marginalia and titles. It can also create an atlas made up of multiple pages with overlaps and page grids. Styles, layouts, and marginalia for common civilian and defense mapping styles are provided. The approach of using the database not just for the feature data but also for layouts and product metadata is a key aspect of the database-centered development strategy. Graphic Control and Visual OutputUnderlying the cartographic visualization capabilities of ArcGIS is a powerful graphics output pipeline that handles stroking, filling, patterning, color, priority, transparency, visibility, masking, and much more. It drives screen output, plotting, and graphic export formats. The graphics pipeline supports powerful visualization capabilities, such as selective masking, that were previously only available in specialized graphics applications. Selective masking allows the user to specify a set of target layers to be masked or erased for each source polygon layer (figure 13). This can greatly increase cartographic clarity, for example, by suppressing road casings where crossed by text without suppressing the road infill. Work continues beyond 9.2 to revise the graphics pipeline for greater performance, new functions, and platform portability. It will improve handling of complex graphics primitives, such as the clipping and merging of patterned fill areas and, hence, reduce plot file sizes—particularly on output to intelligent plotting devices. Support is also planned for new document color models to provide a framework for CMYK, spot, and PANTONE colors and facilitate the use of gradients and textures. ConclusionAdvanced cartographic representation mechanisms and cartographic editing tools will be provided in ArcGIS 9.2. In conjunction with production automation and graphics capabilities described previously, they will dramatically change the scope of automated cartography, facilitating the generation of multiple products from a central database. The human freedom enabled by the override system, combined with the symbolization rule pipeline, will permit high-quality attractive cartography within a database-centered environment. These mechanisms and tools are part of Esri's vision to provide a single, consistent, intuitive, efficient, and liberating mapping environment, used throughout the cartographic communication process. This environment is geodatabase centered, holding master data in addition to specifications, processes, and results of derived products. It releases cartographers from repetitive actions, while providing them with the freedom and tools to amplify their creativity and expression. For more information, contact Paul Hardy, Esri (e-mail: phardy@esri.com). Note: The data used in figures 1, 4, 5, 7, and 13 is swisstopo VECTOR25, copyright Swiss Federal Office of Topography 2006. Data for figure 12 is copyright HarperCollinsPublishers 2006. |
|||||||||||||||||||||||||||||||||||||||||||||