Winter 2005/2006
Winter 2005/2006 |
|||||||
|
|
|||||||
Identify, Profile, and Analyze Customers
Segmentation Module Now Available for ArcGIS 9.1 Business Analyst |
|||||
ArcGIS 9.1 Business Analyst software's optional Segmentation Module provides customer analytics capabilities that enable companies, agencies, and organizations to gain a better understanding of their customers by providing answers to these crucial marketing questions:
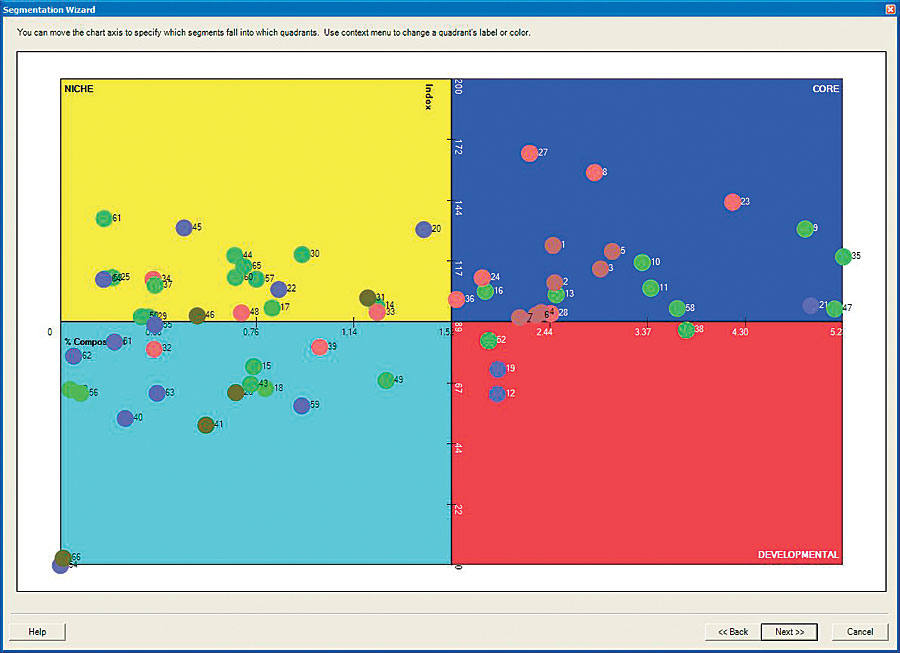
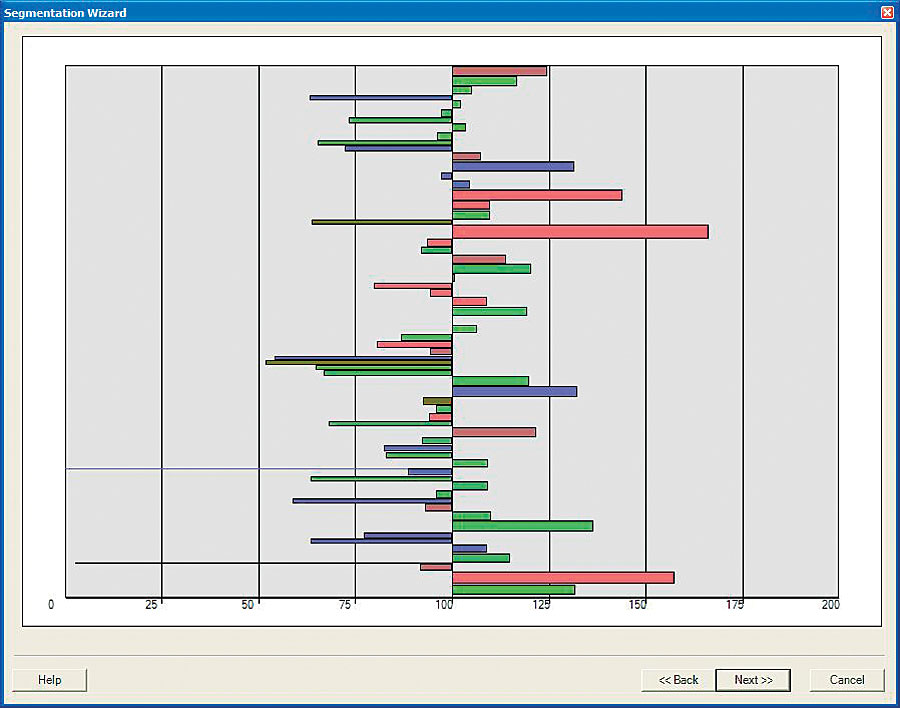
The wizard-driven Segmentation Module integrates with ArcGIS Business Analyst and can be used to understand customer behavior; create target profiles of different customer types; and generate reports, maps, and charts that show detailed data about customers. The Segmentation Module also enables users to identify cross-selling opportunities, reveal secondary markets, and develop comprehensive segmentation studies. Reports created in ArcGIS Business Analyst can be integrated with analyses from the Segmentation Module for more complete output. For example, reports, maps, and analyses can be used to compare customers in an existing trade area to those in prospective expansion areas. Analyses can be refined to not only identify who the customer types are but also who the best customers are for specific market areas. The Segmentation Module includes data, templates, and interactive features such as
Community TapestryThe foundation data in the Segmentation Module is Community Tapestry, Esri's segmentation system. Tapestry classifies U.S. neighborhoods into 66 segments based on their socioeconomic and demographic composition. Esri's data development experts built Tapestry by combining the traditional statistical methodology of cluster analysis with the latest data-mining techniques to provide robust and compelling segmentation of U.S. neighborhoods. This methodology was introduced more than 30 years ago and has become the benchmark for the development of segmentation systems. Data used to build Tapestry include Census 2000, Esri's 2005 demographic updates, Acxiom's InfoBase consumer database, national consumer survey data from MRI, and other sources. Tapestry data can be delivered in a variety of file formats, as well as in maps and online reports based on different levels of geography. The Segmentation Module includes Tapestry data at the block group geography level, enabling users to refine their analysis results by studying smaller groups of customers. MRI
Two user-selected data categories extracted from the MRI consumer survey are included in the Segmentation Module's standard data package. This data can be used to create target profiles to compare against customer profiles and can also serve as surrogate profiles if customer addresses are unavailable. For more comprehensive analysis, all the MRI data categories can be added as an option. Community CoderThe latest version of the Community Coder geocoding software is integrated into the Segmentation Module. Analysts can increase the value of their customer databases by using Community Coder software to add geographic codes, such as latitudes/longitudes, FIPS codes, demographic data, and Tapestry segmentation codes, to each customer record. These data appends will more precisely define customers and prospects, provide better information about customer types in a specified market area, and segment consumers for targeted marketing promotions. The Segmentation Module will allow users to generate detailed reports showing the geocoding statistics, demographic profiles, and Tapestry profiles of customers. Intuitive WizardsCreating presentation-quality reports, charts, and maps that accurately describe customer types is easy with the intuitive wizards that are incorporated in the Segmentation Module. Reports can be produced individually or batched for output in a variety of formats. Annotations provide valuable commentary to help clarify and interpret the results of a Tapestry profile, quadrant map, or Tapestry segment bar chart. Results can be quickly translated into thematic maps to further illustrate analyses. Reports, maps, and charts can also be customized by changing colors, symbols, and ranges. Segmentation StudiesThe Segmentation Module allows users to create comprehensive segmentation studies using Tapestry segments in analyses to identify core and developmental customers in specific market areas. The process begins by integrating customer database records with geographic and Tapestry segmentation codes to enhance the customer file for further analysis. Easy-to-follow instructions guide users through the study development process. Segmentation studies can be customized by using the plus/minus feature to add or delete reports and by adding an organization's logo, colors, and symbols. For ease-of-use, each document in the analysis is color coded; for example, red identifies documents that can be revised, black designates completed documents, and blue designates boilerplate documents. Customized documents and project templates can be saved for future use. For more information about the Segmentation Module in ArcGIS Business Analyst, call 1-800-292-2224. For information about ArcGIS Business Analyst, visit www.esri.com/ba. |