Winter 2008/2009
Winter 2008/2009 |
|||||||
|
|
|||||||
GIS Helps Provide Answers to Public Health Concerns in the City of London, Ontario
Inner-City Population Living in a "Food Desert" |
|||
Highlights
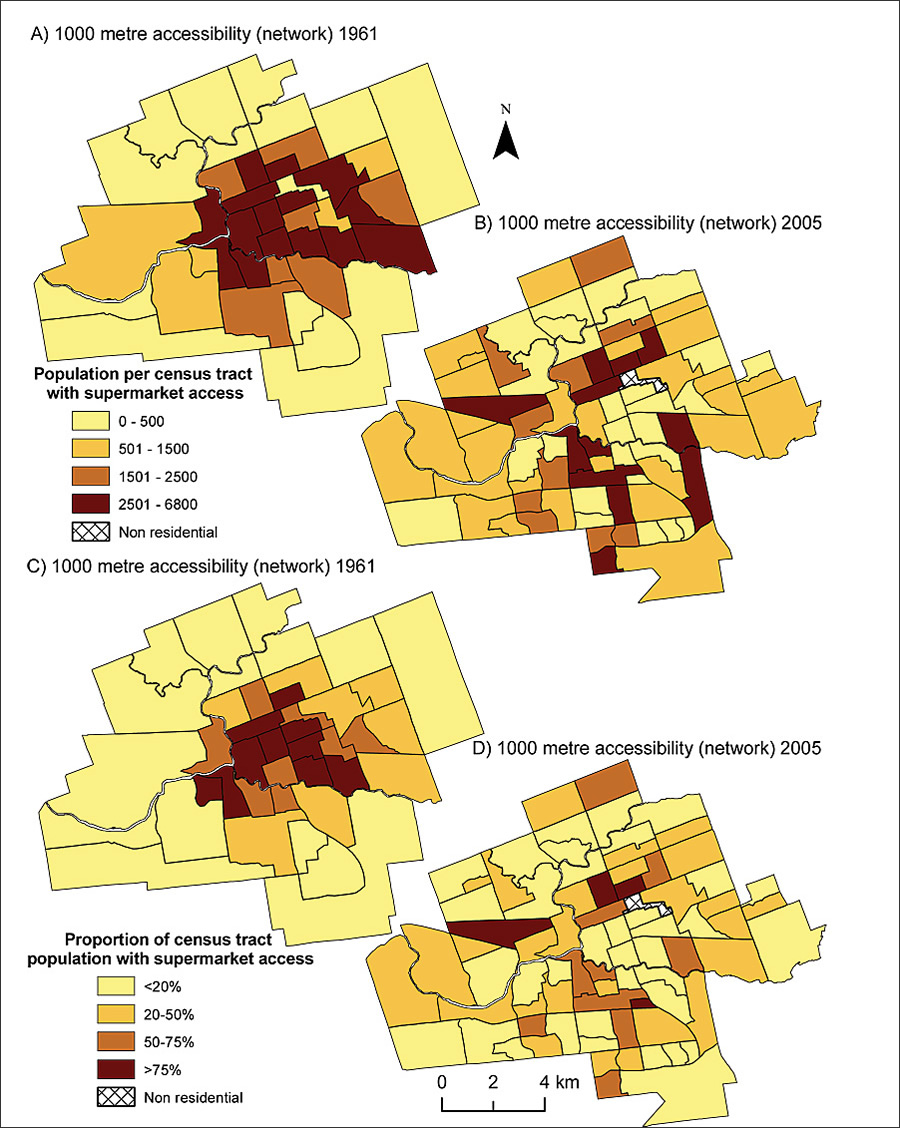
In 2004, Dr. Jason Gilliland, director of the Urban Development Program at the University of Western Ontario, became interested in the problem of supermarket accessibility in the city of London, Ontario, Canada. Numerous editorials in local newspapers suggested that the lack of a major supermarket downtown was stifling efforts to revitalize the downtown area and negatively impacting the quality of life of area residents.
After conducting further research, Gilliland and his coinvestigator Kristian Larsen learned that other cities in Canada, as well as cities in the UK and the United States, also suffered from "food deserts." The term food desert was reputedly first used by a resident of a public sector housing scheme in the west of Scotland in the early 1990s. According to Larsen, a food desert is "a socially distressed neighborhood with relatively low average household incomes and poor access to healthy and affordable food." Food deserts are also often served by a surplus of convenience stores and fast food restaurants. Numerous academic publications and government reports in various countries have been written in recent years that suggest food deserts may damage public health by restricting the availability and affordability of certain foods that may benefit health, such as fresh fruits and vegetables. These reports have influenced several policy recommendations in the UK and the United States designed to promote adequate retail provision of food. Larsen and Gilliland used GIS to plot and analyze the location of London, Ontario's supermarkets in 1961 and 2005. A spatially referenced database was created to explore certain historical and geographic dimensions of supermarket accessibility and neighborhood characteristics over the study period. Supermarket addresses were gathered from local business directories and verified using several additional sources: telephone directories (yellow pages); company Web sites; phone calls to retailers; inspection of air photos, maps, and plans; and site visits. Working through the University of Western Ontario site license, Larsen and Gilliland geocoded the data in ArcGIS 9.2, which Gilliland manually reviewed to ensure extremely high precision. Using Canadian census data and various city maps and bus schedules, they then calculated each neighborhood's access to grocery stores using practical criteria, such as a 1,000-meter distance along the street network (a 10- to 15-minute walk). GIS-based techniques of network analysis (with the ArcGIS Network Analyst extension) were used to determine the accessibility of supermarkets, or the relative ease with which Londoners can reach a supermarket on foot or public transit. Block-level population counts from Statistics Canada were used to identify the population with supermarket access within each service area. Larsen notes, "Blocks are the smallest geographic unit for which Statistics Canada releases population counts and are very useful units for precise spatial analysis." Supermarket service areas were divided into sections and assigned to the appropriate census tract. Larsen and Gilliland also included data on London's public transit network to determine accessibility by city bus. Bus access was determined by using a 10-minute bus ride without transfers, combined with a 500-meter walk (5 to 6 minutes) at the beginning and/or end of the bus trip. Bus schedules and route data of the London Transit Commission (LTC) were used to determine that a 10-minute bus ride covers a trip of 3 kilometers. ArcGIS Network Analyst was used to select and map individual bus routes that are located within 500 meters and extend up to 3 kilometers from each supermarket; a 500-meter network service area was created around each identified bus route to determine areas with public transit access to supermarkets. The City of London street network file (provided by the City Planning Department) and the ArcGIS Network Analyst extension were used to determine the minimum distance residents must walk to the closest supermarket. This distance calculates the shortest path along the street network from every block centroid (within the urbanized area) to the closest supermarket. The data was then aggregated to the census tract level (a commonly used proxy for a neighborhood) for further analysis and to allow comparison with socioeconomic characteristics of neighborhoods in the same manner as previous Canadian studies. Analysis indicated that supermarket access has diminished over time, as the average proportion of census tract population with easy supermarket access in 1961 (45.2 percent) was more than twice the level for 2005 (18.3 percent). Furthermore, their field research showed that people living in food deserts, who must shop at small local convenience stores for a list of basic supplies, would pay almost double the price compared with their supermarket-shopping counterparts. Historical analysis showed that inner-city areas were not always food deserts even though the city population has doubled in the past 50 years. Back in 1961, more than 75 percent of London's downtown core population had easy access to a supermarket, whereas less than 20 percent of the urban core population has access today. Gilliland, who is also an associate scientist with the Children's Health Research Institute, explains: "More and more supermarkets are building in newer suburbs, and smaller food shops are disappearing from older neighborhoods, leaving food deserts in their wake." More InformationFor more information, contact Jason Gilliland (e-mail: jgillila@uwo.ca) or visit www.ij-healthgeographics.com/content/7/1/16. |