Winter 2008/2009
Winter 2008/2009 |
|||||||
|
|
|||||||
Woods Hole Research Center Measures Carbon Footprints in U.S. Forests with GIS |
||||||||||
Highlights
How do we retrace our ecological footprints? Where will the footprints lead? Scientists at the Woods Hole Research Center (WHRC), Falmouth, Massachusetts, are tracking carbon footprints across the globe starting with U.S. forests. One ongoing study, using GIS technology, is measuring the carbon-rich biomass in heavily wooded areas to indicate the effect deforestation and land use have on rising carbon levels in our atmosphere.
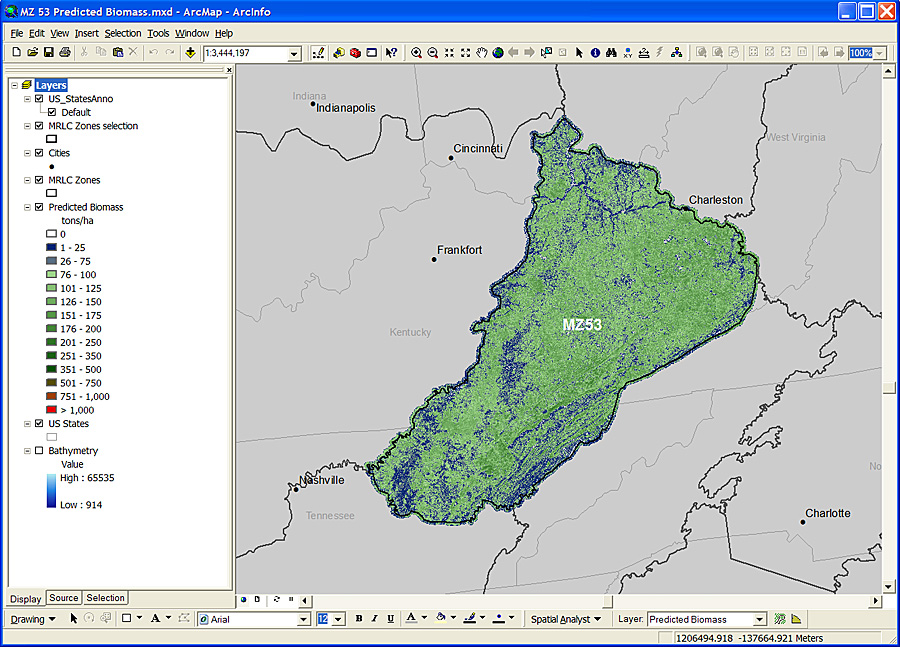
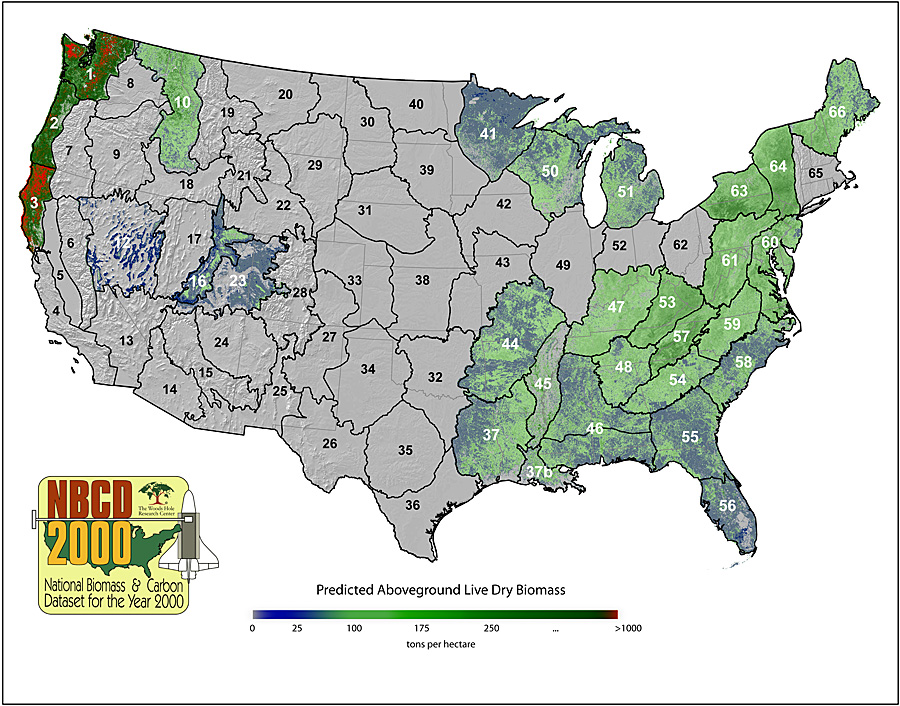
The National Biomass and Carbon Dataset for the year 2000 (NBCD2000) will serve as a baseline for quantifying carbon stock in U.S. forests. The information can then be used to improve current methods of assessing carbon flux between forests and the atmosphere. To establish the baseline, researchers fed many layers of data into the GIS, including National Aeronautics and Space Administration (NASA) satellite imagery, topographic survey data, land-use/land-cover information, and extensive forest inventory data collected by the U.S. Department of Agriculture (USDA) Forest Service Forest Inventory and Analysis (FIA) program. "The datasets that are now available should be of interest to natural resource managers across the country," says Josef Kellndorfer, an associate scientist at WHRC and leader of the NBCD2000 project. "The availability of high-resolution estimates of forest biomass and associated carbon stock is an important step forward in understanding the North American carbon balance." Mapping projects target 67 ecologically diverse regions—mapping zones that span the conterminous United States. Of the nine completed zones, five were finished during a two-year pilot phase. Work on the remaining zones will be completed at a rate of roughly one zone every seven days. The project is scheduled for completion in early 2009. The NBCD2000 initiative started in 2005 and is funded by NASA's earth science program with additional support from U.S. Geological Survey (USGS)/LANDFIRE.
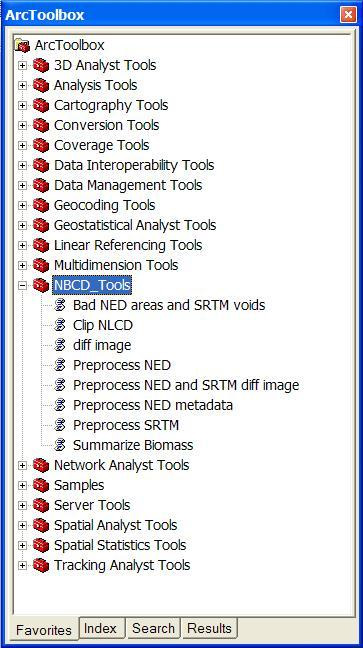
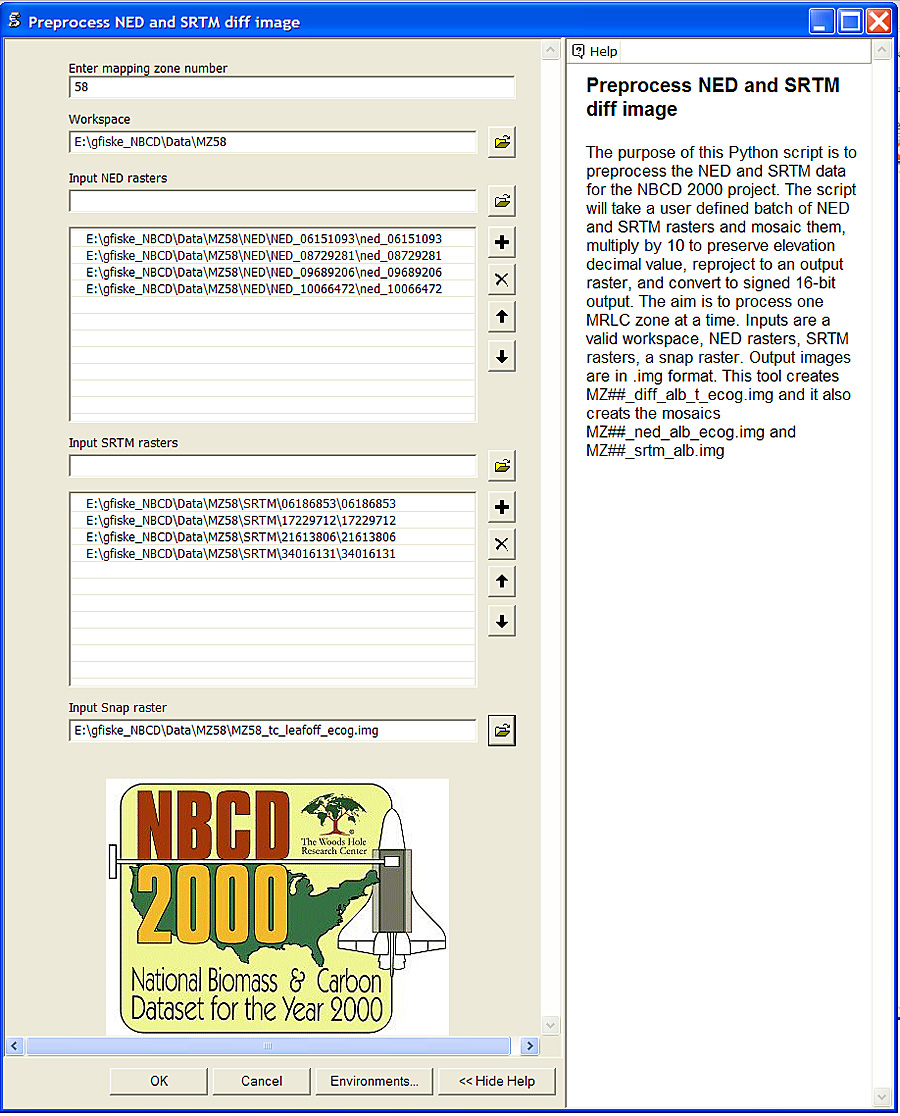
ArcGIS Desktop and ArcGIS Server are being used to manage the data and create the maps. "The work of our GIS users depends on the symbiosis of digital image processing software and GIS software," says John P. Holdren, WHRC director. Many of the center's GIS users have completed Esri's online courses and classroom training, and ArcGIS is ubiquitous among WHRC's spatial analysts. Within each mapping zone, data from the 2000 Shuttle Radar Topography Mission is combined with topographic survey data from the National Elevation Database (NED) to produce a radar-based map of vegetation canopy height. Subsequently, the map illustrates estimates of actual vegetation height, biomass, and carbon stock using survey data from the FIA program and ancillary datasets from the National Land Cover Database 2001 (NLCD2001) project. The NLCD2001 data layers are crucial inputs to the NBCD2000 project as they provide land-cover and canopy density information used in the stratification/calibration process. Says Diane Wickland, program manager for NASA's Terrestrial Ecology program, "Because this is the first systematic, regional-scale study that uses radar data to quantify carbon storage in vegetation, the end result will not only provide valuable information on how well we can do with existing data but will allow us to see how we might improve and refine requirements for future, more capable missions." The Case for Measuring CarbonEcologists have been interested in carbon for a long time, according to WHRC scientist Richard Houghton, primarily because all plants and animals are made of carbon. More recently, carbon has become interesting to scientists—and many other people—because carbon dioxide is the major greenhouse gas produced by human activity.
"The continued release of greenhouse gases is raising the temperature of the earth, disrupting the climate we and our agricultural systems depend on, and raising the sea level," Houghton states. "The concentration of CO2 in the atmosphere has already increased by about 30 percent since the start of the Industrial Revolution sometime around the middle of the 19th century. It will continue to increase unless societies choose to change their ways." Most of the increase in atmospheric CO2 concentrations has been and will continue to be from the use of fossil fuel for energy. About 25 percent of the increase over the last 150 years has come from changes in land use—the clearing of forests and cultivation of soils for food production. Much of the carbon stored in trees and soils is released into the atmosphere when forests are cleared and cultivated. Some of the release occurs rapidly with burning. Some of it occurs slowly as dead plant material decomposes. When forests regrow on cleared land, they withdraw carbon from the atmosphere and store it again in trees and soils. The difference between the total amount of carbon released into the atmosphere and the total amount withdrawn from the atmosphere determines whether the land is a net source or sink for atmospheric carbon. WHRC scientists therefore study the rates of land-use change or deforestation and the sources and sinks of carbon that follow. The Use of GIS in Conservation
With ArcGIS, researchers are able to analyze and illustrate changes on the earth, manage findings in an easily accessible database, and model through maps the effects of various future land-use and carbon-related decisions. "Almost all ecological research is inherently spatial and needs to be put into a local or regional context," states Holdren. "Among a text-weary public, maps are perhaps the most direct route to understanding research results and the status of the earth's natural resources." WHRC has initiatives in the Amazon, the Arctic, Africa, Russia, Asia, and North America. Center programs focus on the global carbon cycle, forest function, land cover and land use, water cycles, chemicals in the environment, science in public affairs, and education, providing primary data and enabling better appraisals of the trends in forests (see sidebar below). WHRC scientists recently released initial data from NBCD2000. All data products are available for download on a zone-by-zone basis at www.whrc.org/nbcd. More InformationFor more information, contact Gregory J. Fiske, research associate, Woods Hole Research Center (tel.: 508-540-9900, ext. 139; e-mail: gfiske@whrc.org).
|