Winter 2009/2010
Winter 2009/2010 |
|||||||
|
|
|||||||
Eugene, Oregon, Police Department Uses GIS to Make Sense of Its Data
Piecing Together the Data Puzzle |
|||
Highlights
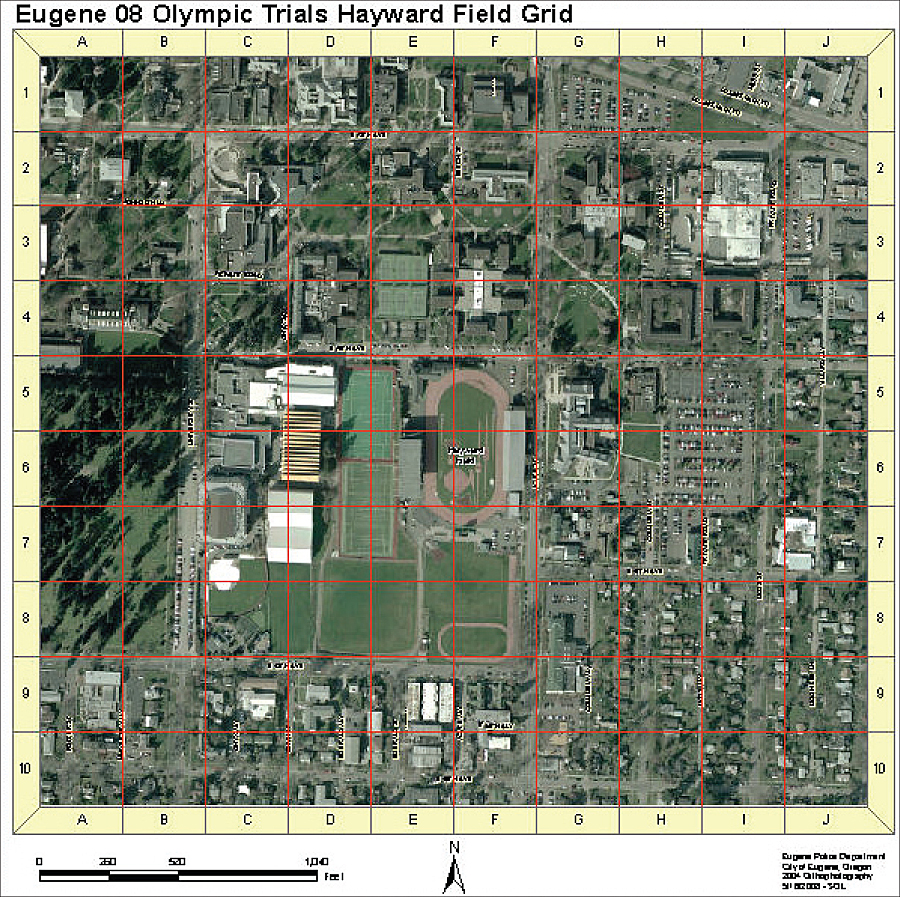
The Eugene, Oregon, Police Department (EPD) is a progressive crime-fighting agency. The organization combines old-fashioned policing with a high-tech philosophy to best serve its more than 140,000 residents. In a typical day, Eugene police officers are dispatched to roughly 300 calls for service, and 25,000 criminal cases are handled annually.
EPD staff members also engage in proactive community education and crime prevention activities, with offerings ranging from an annual Safety Town program for prekindergartners to seminars about recognizing and preventing elder abuse. To improve the quality of these and other ongoing programs, the department uses GIS to link the torrents of data that are now part and parcel of a modern, urban police force. Data capture now includes records management data, computer-aided dispatch data, situational awareness reports, incident accounts, accident descriptions, traffic violations, code infractions, calls for service, and information from other sources. These are all now made available for analysis through one coherent, easily shared information resource. Commanders make long-term strategic decisions using high-level spatial analysis, frontline officers use mapped data for better decisions in the field, and a public Web site helps the agency keep its citizens informed of crime rates in their neighborhoods. One of the department's greatest GIS successes involved the use of spatial analysis and high-powered visualization for providing security during the 2008 U.S. Olympic Team Trials for track and field, which Eugene hosted from June 27 to July 6. GIS helped the department plan policing duties, effectively place equipment and security resources, and monitor events on the ground. By generating a map-based common operating picture, staff could effectively monitor events and dynamically respond to changing conditions on the fly. Industry-Specific Software"Originally, the agency acquired a software product for simple pin mapping," says Stan Lenhart, crime analyst, Eugene Police Department. "I came on board as a crime analyst and brought in a more powerful, industry-specific GIS application with tools to do better analysis." Jumping from simple desktop pin mapping to a more powerful desktop and Web GIS has resulted in more arrests and safer streets. Specifically, following Lenhart's recommendation, the agency deployed CrimeView, a GIS desktop solution from Esri Business Partner The Omega Group, based in San Diego, California. This ArcGIS software-based solution supplies an advanced interface to CAD and records management system databases. EPD uses CrimeView to perform sophisticated spatial computing operations: assist with data management and mapping, perform queries, generate reports, carry out analysis, and create maps. "We use GIS now for long-term planning and daily operations," Lenhart says. "It also really paid dividends for the Olympic Trials. It won't make decisions for you. That's what I get paid to do. But it helps us deliver more accurate information faster to all of our officers." Unlocking Crime DataOver time, law enforcement has become a data-intensive industry. Each data point requires records that are brought into a database. These databases were once stored separately. Getting the most out of the ever-growing, isolated repositories used to be complex and daunting. Now, however, officers can query data by attribute, geographic boundary, or proximity to a location or specified landmark. They can build density maps, such as clustering residential burglaries, to see where to best allocate officers to respond to crime. Hot spot maps help depict areas of high, moderate, and low crime rates. For instance, data from the records management system can be extracted and mapped to show excessive concentrations of assaults for a four-week time period. Maps are also generated showing repeat calls. If an address has a particularly high rate of calls, officers can use a map interface to click the address icon and view a data table showing the number of recent calls and their related data, such as incident type, responding officer, resulting action, and date and time of the call. Lenhart also uses GIS tools to develop crime reports presented during monthly CrimeStat meetings. Spatial trend maps compare changes in crime patterns via a map view over specified time periods—for instance, robberies between two successive years. This gives commanders a macro-level understanding of crime trends. They can then better determine exactly where and how to respond to existing conditions on the ground. Securing the U.S. Olympic TrialsThe University of Oregon, located in Eugene, was host to the 2008 U.S. Olympic Team Trials for track and field. Attendees from across the country descended on the college grounds—renowned for top-notch sporting facilities—to witness athletes compete in events ranging from sprinting to the javelin throw that were the culmination of years of hard work. Held at the university's Hayward Athletic Field, the 10-day event attracted more than 165,000 people, making it the third highest in attendance for U.S. track and field Olympic trials. The trials required comprehensive security. Providing safety for athletes, coaches, and Olympic judges and officials, as well as thousands of attendees, is no simple task. It involves properly assessing potential risks; understanding assets on the ground, including buildings, transportation corridors, housing, and street infrastructure; and planning for numerous contingencies, from simple car accidents, arrests, and medical emergencies to potential large-scale natural hazards or terrorist strikes. "We spent the better part of a year working on a lot of different security issues," explains Lenhart. "Our GIS helped bring in data from multiple sources and view it using one comprehensive system. One of the issues that we had was that we had so many different law enforcement agencies from outside the area coming in to assist us that were unfamiliar with this area. We were able to build some aerial maps with a lot of landmarks so that they could get familiar with the areas they would be working." ArcGIS was used to build a grid system so that the agency could assign people to sectors and ensure the entire grounds were covered. A central emergency command center was staffed by analysts; commanders; and representatives from local, state, and federal agencies. Participating agencies included the Bureau of Alcohol, Tobacco, Firearms and Explosives; Eugene Police Department; Federal Bureau of Investigation; Oregon Department of Justice; Oregon National Guard; and University of Oregon campus security. A large 10- by 10-foot digital map projection was displayed on one of the center's walls. Staff could pan and zoom and move around the digital map display to see different areas of the event. Recently captured aerial photography, oblique imagery, and digital map layers showing buildings, electric facilities, roads, parcels, district boundaries, underground tunnels, athletic staging areas, security staff locations, emergency medical services locations, and other data, were all available to be viewed as needed. A security perimeter was generated, along with separate entry points for attendees and athletes. Bus routes and drop locations were also calculated to be in close proximity to entrance locations, providing safety and security while at the same time ensuring the fastest possible entrance into the sporting event. In addition, video cameras provided a real-time view of events. If personnel moved from one area of the athletic grounds to another, they could be seen by camera and recorded as a point on the map. The command center also had GIS map layers showing where vendors were allowed to operate. Prior to the actual trials, staff used oblique imagery managed in ArcGIS to view buildings in such a way as to determine where to properly place cameras. They could look at a particular camera location to see if it would be unobstructed or if it would be hindered by another building wall or some other object, like trees or foliage. During the trials, data was updated in the geodatabase and reflected in the common operating map. For instance, if an arrest or emergency incident occurred, it could be instantly annotated on the map. Data was used to respond to specific events, as well as to catalog everything that was happening, in near real time. "At any given moment, incident commanders could see what was happening on the ground," says Lenhart. "If an incident was occurring, they could bring a response team into the Emergency Operations Center in front of that map and say, �We've got this going on here. We need Oregon Department of Transportation to go over and put a roadblock at this intersection here.'" ArcGIS was also used to generate action reports and maps for daily morning briefings, which Lenhart provided to field staffers and commanders' staff so they were aware of the previous day's activities. The year of preplanning and on-scene due diligence paid powerful dividends. The event was a smoothly run operation, with no major incidents or emergencies. This is especially important as Eugene prepares for hosting the trials again in 2012. "You have to educate your planners about the tools, their availability, and what they can do," emphasizes Lenhart. "Make sure that you include GIS early on as an integral part of the planning process. It can help in all phases of planning, making updates, sharing information, and working more effectively in a coordinated manner." More InformationFor more information, contact Stan Lenhart, crime analyst, City of Eugene Police Department (e-mail: stan.o.lenhart@ci.eugene.or.us, tel.: 541-682-5163), or The Omega Group (e-mail: omega@theomegagroup.com, tel.: 800-228-1059, Web: www.theomegagroup.com). |