Winter 2009/2010
Winter 2009/2010 |
|||||||
|
|
|||||||
Portland, Oregon, Trailblazes a Successful Regional GIS |
|||||||||
|
By Matteo Luccio Highlights
People from around the world come to Portland, Oregon, to study the city's successful model for growth management and comprehensive land-use planning. Few, however, know that this success is enabled by a regional land information system (RLIS) that was conceived and implemented 20 years ago by Metro, the first elected regional government in the United States, along with cooperating local jurisdictions, to help meet state planning requirements. RLIS has since been the key tool used to plan, evaluate policy, and formulate development models in the Portland area. Metro, which comprises three counties and 25 cities, secured the funding and political support required for the system, covering 544 square miles, through two visionary arrangements. First, it convinced the region's electric utility company, PGE, to share its CAD file of tax lot boundaries. In return, Metro would return the file to PGE in GIS format and produce quarterly updates. Second, Metro offered to share its system with the cities and counties in its jurisdiction in exchange for their agreement to maintain the data and give Metro periodic updates. To gain support from Metro's leadership, the project team quickly produced a map to demonstrate the system's capabilities.
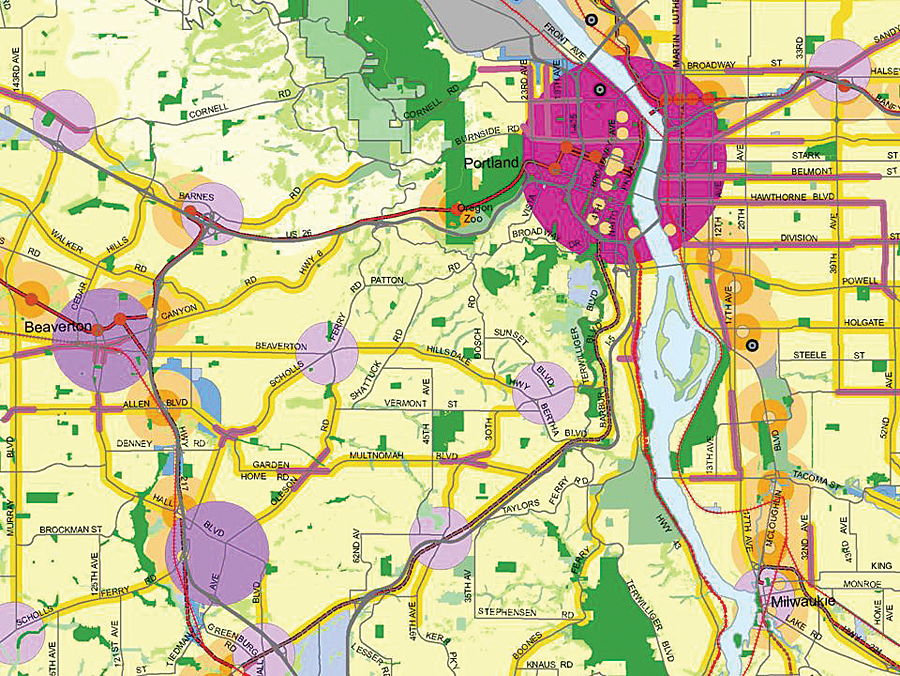
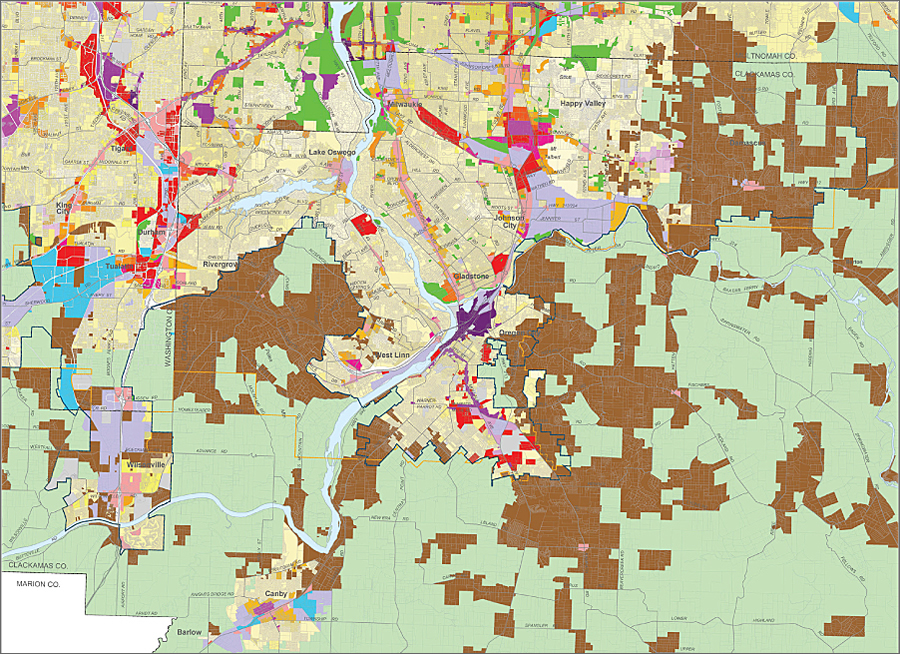
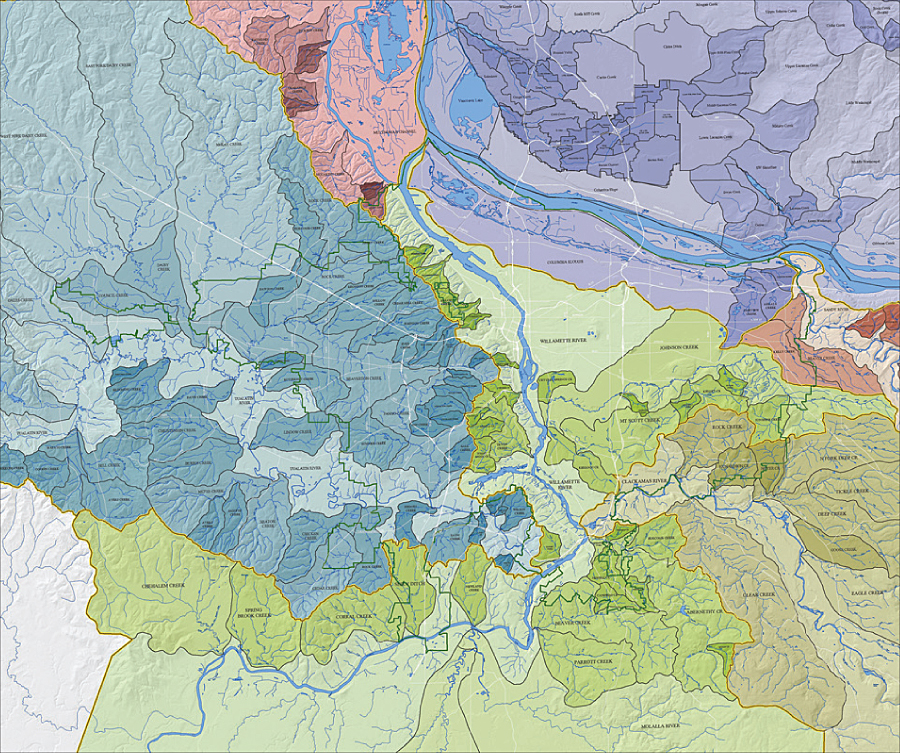
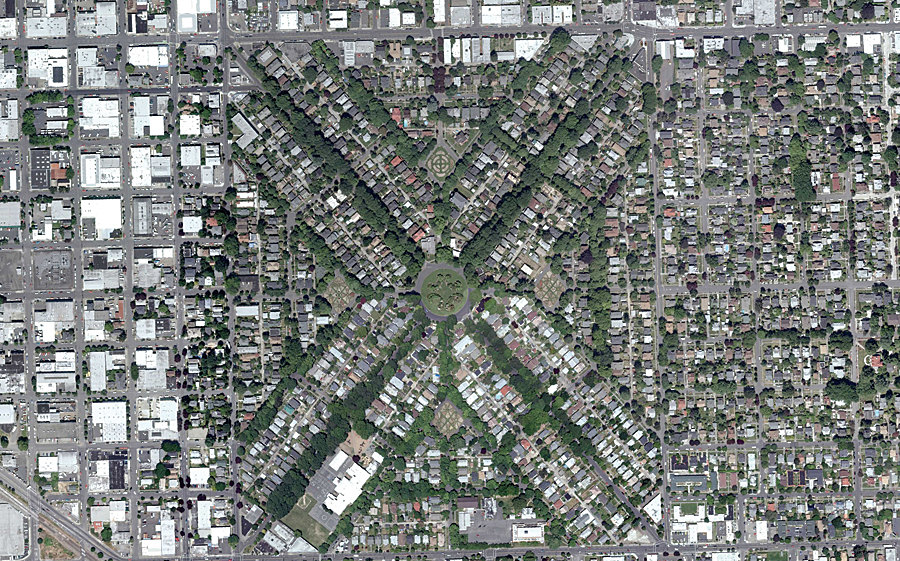
Metro also engaged in entrepreneurial efforts to generate revenue to cover approximately 40 percent of RLIS' maintenance costs. The business community supported these efforts, because they would allow Metro to produce the accurate and timely data it needed. From the beginning in 1989, Metro standardized RLIS on Esri products and developed data standards cooperatively with its local partners. Today, real estate and development companies routinely purchase RLIS data and use Metro's map Web site. Emergency management agencies pay Metro to maintain their street address files. To partly automate public access to RLIS data, Metro has developed a Web interface and sells annual subscriptions to the RLIS Lite quarterly CD-ROM series. Planning in OregonIn 1973, Oregon mandated all jurisdictions to develop comprehensive plans, and the next year it required every incorporated city to adopt an urban growth boundary (UGB) encompassing a 20-year reserve of land. Responsibility for the Portland UGB falls on Metro, which serves more than 1.4 million residents. In the early 1980s, Metro began to develop transportation models and forecasts; in the late 1980s, the statewide planning law required it to review its UGB, and it began to develop regional urban growth goals and objectives; and in 1992, Metro and the local jurisdictions began a planning process that led to the adoption of a 50-year vision for urban growth within Metro's boundaries. RLISRLIS was started as a pilot project in 1989, and an operational GIS was ready early in 1991—that is, RLIS was born at about the same time as this planning process and yielded its first products at about the same time that the urban growth goals and objectives were adopted. Using RLIS to drive transportation and air quality models using parcel-level data for the first time, Metro was able to test alternative growth scenarios. Metro designed RLIS in collaboration with planners, with the aim of identifying the requirements of a GIS that would support both community and regional planning and provide consistent land information across jurisdictional boundaries. For the basemap, regional planners preferred a much cheaper and simpler zonal system, using U.S. census tracts or traffic analysis zones. However, planners for local jurisdictions, whose financial support was essential for RLIS, preferred one based on tax lots, which would enable community-scale planning and linking tax lots to county assessor records. Therefore, the regional planners agreed to take on the huge task of building a tax lot-based GIS. Twenty years later, Metro now depends on this level of acuity for such projects as land-use forecasting. To accomplish that task, Metro then outsourced the conversion from CAD to GIS of PGE's tax lot data, which took 16 months. The polygons were assigned tax lot ID numbers, linking them to tabular tax assessment records. The Oregon Department of Transportation provided street centerlines, street names, city limits, rivers, and other layers. Streets are now the alternate base layer in RLIS and are used for vehicle routing, thematic mapping, census data, and transportation analysis zones. A primary purpose of RLIS is to monitor land development and future growth capacity. To accurately identify vacant land, since 1991 Metro has relied on annual true-color digital orthorectified aerial photography for the region. Each year, two GIS technicians spend two months updating the inventory by overlaying current building permit records over aerial photos and applying strict rules to determine whether a tax lot is vacant, partly vacant, or developed. GIS Powers the Model
At first, Metro's Data Resource Center (DRC), which created and manages RLIS, used all the Esri GIS tools then available to build and maintain the main RLIS components, such as boundaries, streets, and tax lots. Metro took advantage of ArcView software's shapefile format to release RLIS Lite in 1996, which allowed it to distribute the data, without tiling, in a format that could be used by a wider audience. In 1998, Metro used MapObjects to write an application for its Recycling Information Center. Metro was an early adopter of ArcSDE in 1998 and for 10 years used it for data publishing only. In 1999, it installed ArcIMS, which served ArcSDE layers to the public. From 2000 to 2008, Metro worked on converting its legacy ARC Macro Language (AML)/coverage processes to ArcGIS, and by 2008 it had converted all editing to a multiuser geodatabase. Metro also frequently uses ArcReader, ArcGIS Spatial Analyst, Esri Business Analyst, and ArcGIS 3D Analyst for its project-level work. Now the DRC devotes about half its staff time to serving the internal data and mapping needs of Metro departments, about a third to serving the needs of partner jurisdictions, and about a tenth to providing services to the public. Key FactorsA unique combination of factors required and enabled the development of RLIS and its successful implementation:
Key Operational Choices
A few early operational choices by Metro staff members were key to the success of RLIS. First and foremost, they decided to build a GIS, rather than a CAD system, despite the fact that Multnomah County, which had already invested millions of dollars in its CAD systems, pushed Metro hard to follow that path. In addition, they chose to take on parcel-level data and set up the data model cooperatively with the local jurisdictions, which then all adopted it. The local jurisdictions provided quarterly the data they produced in the normal course of business, which the DRC then stitched together and returned to the jurisdictions in the form of the whole region, without any money changing hands. From the start, Metro has collected data for each RLIS layer from the agency that relies on it the most and built only the layers that it can reliably maintain. A regional GIS steering committee has fostered regional cooperation, and Metro has kept the structure of RLIS as stable as possible to enable comparisons over time. Another vital decision was to set up an aerial photography consortium to buy a single annual flight for the whole region, which ensures consistency and greatly reduces costs. What RLIS Has Made PossibleRLIS has enormously impacted planning in the Portland area, and many applications have been built on top of it. It keeps people from getting into useless arguments by providing a very transparent and peer-reviewed fact base. RLIS has provided planners with a new set of tools that enables them to model, simulate, and plan future land development in detail—including the first parcel-level basemap and land-use maps for the region; new mapping and analytic tools that enabled the growth concept to emerge at the parcel level; and many new ways to measure and monitor environmental, social, and economic variables. RLIS has also enabled the creation of new tools for citizen involvement, including modeling that shows the impacts of user-defined land-use policy choices, and has created opportunities for entrepreneurs, such as way-finding software. Additionally, RLIS combines the information about parcels, such as assessed land values, sales values, and property taxes, with regulatory and environmental variables, such as zoning, floodplains, wetlands, and slopes. Finally, cities and counties have incorporated RLIS data into their planning information database, developers use Metro's vacant lands inventory to find land available for construction, environmental organizations and neighborhood associations use RLIS to map out their strategies, and consultants and scholars use RLIS for policy analysis and research. The Future of RLISMetro's staff is reevaluating the methods it uses to maintain and distribute RLIS data and is moving toward a more enterprise-centric model, with a central multiuser geodatabase at the hub. This will allow Metro to maintain data and distribute it to partners and subscribers on a more frequent schedule. Distribution methods will include ArcGIS services, direct FTP downloads, and direct network connections to the server. These different forms of connectivity will also lay the groundwork for experimenting with distributed editing with local data partners. In the future, RLIS might allow users to edit and download data directly, through a server. New uses of RLIS might include gathering information about energy consumption and carbon emissions at the building level. Some hope that, ultimately, RLIS could be continuously updated and serve data as a service. About the AuthorMatteo Luccio is the president of Pale Blue Dot Research, Writing, and Editing, LLC (www.palebluedotllc.com), which specializes in public policy and geospatial technologies. He has been writing about geospatial technologies since 2000 for eight different technical publications and was previously a public policy research analyst for a private think tank and for state and local government agencies. More InformationFor more information, contact Paul Couey, manager, Metro Data Resource Center (e-mail: paul.couey@oregonmetro.gov, tel.: 503-797-1897, Web: www.oregonmetro.gov/drc), or Matteo Luccio, president, Pale Blue Dot Research, Writing, and Editing, LLC (e-mail: matteo@palebluedotllc.com, tel.: 541-543-0525). To view a longer version of this article, visit www.palebluedotllc.com. |