Spatial Data Infrastructure for K–12 School Attendance Boundaries
Highlights
- The system uses GIS to collect and disseminate school attendance boundaries to researchers and the public for free.
- Users have access to the detailed population characteristics of children who live within each school zone.
- The national clearinghouse uses ArcGIS to help government agencies administer educational services.
School attendance boundaries matter to us all. They are as vital to home buyers, who want to make sure their children will attend an excellent elementary school, as they are in the conference rooms of the U.S. Department of Education, where matters of policy and funding are decided.
Even well into the twenty-first century, the United States has lacked a central database that delineates elementary, middle, and high-school attendance boundaries. This informational deficiency has spawned inefficiency among local, state, and federal agencies and has hampered the ability of researchers to conduct large-scale research studies related to educational outcomes among schoolchildren.
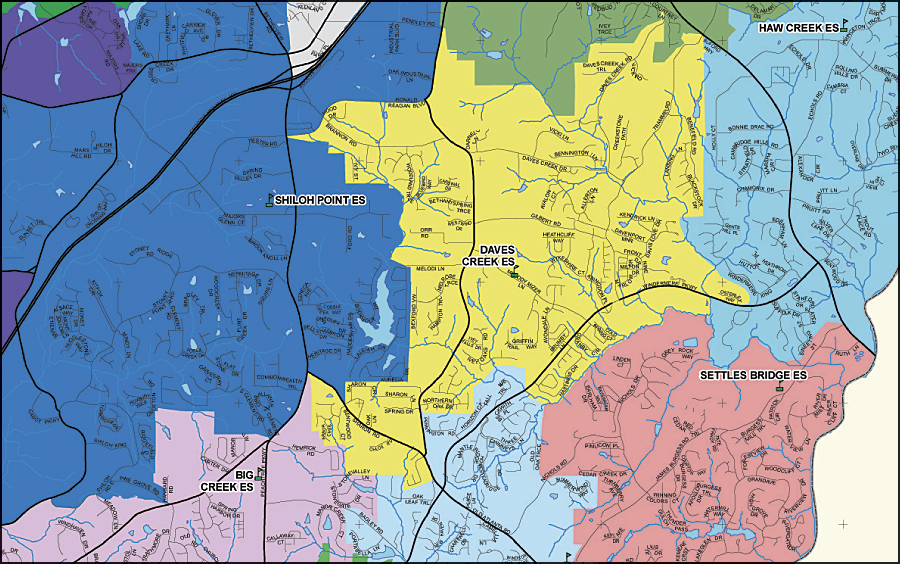
Detail of Forsyth County, Georgia, elementary school attendance zones (2009–2010). Many school districts use GIS to create maps of their school attendance boundaries and post them on their Web site. SABINS requests the electronic GIS files and enters them into a uniform database.
Creating a national database requires reconciling a massive amount of spatial information that is scattered across thousands of school districts and stored in inconsistent formats. This is because K–12 education is controlled by local school boards, and no federal law governs how local school districts should draw their K–12 school attendance areas.
How to collect geographic data is only part of the problem. Schools do not follow consistent grade structures between school districts—and even within single school districts, there are "elementary" schools with grades spanning K–1, K–3, K–4, 5–6, and K–8. Middle and high schools are just as varied and have grade spans such as 5–8, 8–9, and 9–12. Piecing together the geography for these varied grade structures is challenging.
In addition to coping with inconsistent grade spans, it is difficult to assemble school zone information scattered between private consulting firms, county GIS offices, and school districts—and stored in a wide variety of incompatible, spatially incoherent GIS formats, as paper maps, as narrative descriptions, or in databases listing the addresses served by each school. Collecting such information requires thousands of phone calls and e-mails. In the past, researchers who wanted to conduct studies that demanded spatial data delineating school attendance boundaries have been forced to develop their own maps for just a handful of school districts at great time and expense. Even federal agencies have been daunted by the task.
Taking on the Challenge
One of the first people to take on the challenge of using school zones in academic research was Salvatore Saporito, a sociology professor at the College of William and Mary. Saporito first began using school attendance boundaries in the mid-1990s for his doctoral thesis. His research asked a novel question: How does the demographic composition within school attendance zones influence a student's decision to enroll in a private school? To answer this question, Saporito collected school attendance boundaries for the 22 largest school districts in the United States. Using GIS data allowed Saporito to locate students within school attendance zones. Findings showed that white children who lived in a school attendance zone with higher rates of nonwhite students were more likely to apply to a private school—even when their locally zoned neighborhood school was very good.
Following the publication of his research, Saporito's colleagues requested the GIS data of school attendance boundaries that he collected—they wanted the data for their own research. The high demand for digital GIS data inspired the creation of the School Attendance Boundary Information System (SABINS), which is a National Spatial Data Infrastructure project supported with a $1,000,000 grant from the U.S. National Science Foundation. SABINS data can be downloaded from the National Historical GIS (nhgis.org) housed at the Minnesota Population Center. Much of the data collection, processing, and integration are completed at William and Mary's Center for Geospatial Analysis, an interdisciplinary laboratory that was created to facilitate GIS in teaching and research.
Roughly half of the information collected is in digital GIS format—most often stored as Esri shapefiles or geodatabases—and the prevalence of data stored in Esri format is just one reason why SABINS makes extensive use of ArcGIS software (through its Esri university site license). The quality of the local GIS data varies, and this presents two challenges that can be overcome with functions available in ArcGIS Desktop. First, much of the GIS data that the SABINS project receives has gaps and overlaps between school attendance boundaries, and these topological errors need to be corrected. In many cases, elementary, middle, and high school attendance boundaries do not share a common line even when it is evident that they should. A second challenge is harmonizing the inconsistent grade structure of school attendance boundaries within and between school districts. The solution is to create grade-specific attendance boundaries, and SABINS data consists of separate layers for kindergarten through twelfth grade.
Students Learn GIS Through Real Situations
The SABINS project serves as an ideal teaching ground for undergraduate students who want to learn GIS. Saporito teaches a studio course in which the challenges of collecting, processing, cleaning, and storing school attendance boundaries are at the core of a hands-on learning experience. Saporito says, "The goal is to teach a course that avoids fabricating examples of how GIS might work in the real world. Instead, by analyzing original GIS data, students encounter real situations that researchers have not seen before because we don't fully understand how different districts delineate their school geography. Students have to use GIS to solve the unique challenges they encounter."
Undergraduate students who complete Saporito's course are hired as undergraduate research assistants and work on the SABINS project. Many of Saporito's former students now work with GIS in organizations such as the U.S. Census Bureau—which also relies on Esri software.
All the school boundary data is linked with school-level information from the U.S. Department of Education. This information provides student enrollment data by ethnicity and poverty status. School attendance boundaries are also integrated with U.S. Census data that provides detailed demographic information of the children who live in each school zone. In addition to aiding researchers, SABINS also has the potential to save government agencies and school districts money. For instance, the U.S. Department of Agriculture (USDA) oversees $17 billion in subsidized school meals. Districts give free-lunch applications to students, and completed applications are used to tally the number of children in a school who are eligible for a subsidized meal. This approach is expensive and has spurred the USDA to work with SABINS to explore ways that school attendance boundaries can be used to distribute lunches—potentially saving local districts millions of dollars in administrative costs.
For more information, contact Salvatore Saporito, associate professor, Department of Sociology, the College of William and Mary (e-mail: sjspao@wm.edu).