Rural Utility Gains New View of Network, Secures USDA Funding
Highlights
- The utility uses ArcGIS to look at individual customer accounts rather than rely on estimates and averages.
- GIS helps the utility manage and display report data in an organized structure.
- For planning and reporting, the utility relies on GIS-based maps that show load projection.
Carroll Electric Cooperative Corporation is a not-for-profit electric utility serving northwest Arkansas and southwest Missouri. To keep pace with the evolving needs of the industry, the company recently secured funding from the US Department of Agriculture's (USDA) Rural Development program for utilities that is available under the Rural Electrification Act of 1936. Direct loans and loan guarantees are available for facility construction, demand management, renewable energy development, and energy conservation programs.
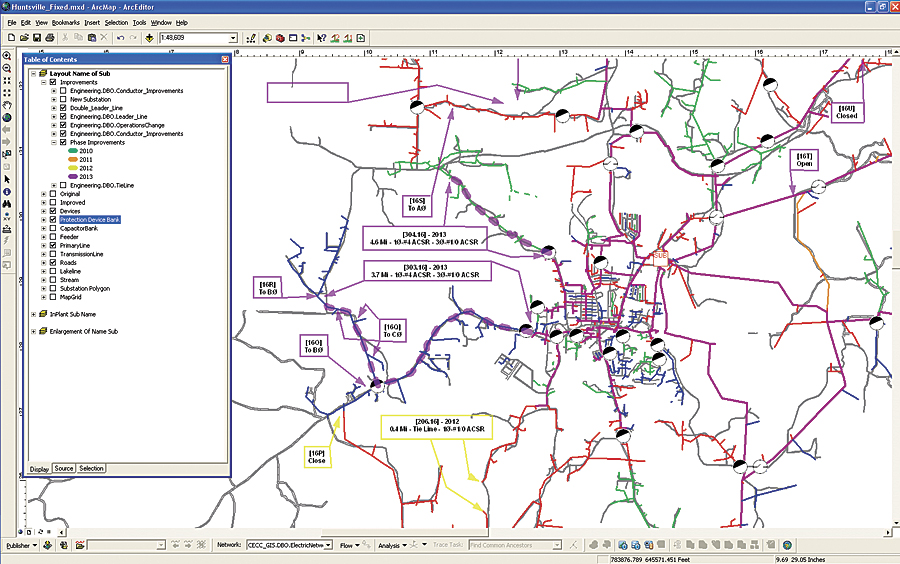
Map produced from Milsoft Utility Solutions data. Carroll Electric's Electrical System Improvement map helped the utility garner US Department of Agriculture funding.
As part of the process, Carroll Electric staff needed to acquire and clean up utility data stored in its GIS. The utility used the data to perform in-house analysis and planning to design a work plan that ensures growth and reliability. Plans are then reviewed, approved, and amended as needed within ArcGIS.
The move to ArcGIS has shown a significant difference in the loan application and reporting process. It has also changed the way the electric network is viewed by utility staff and the government agency.
"Using CAD, we were getting a very broad view of our system," says Taylor Wynn, GIS coordinator for Carroll Electric. "Since GIS is data driven, we get a more detailed view. Now, instead of basing estimates on an average load, we can look at individual customer accounts. We know how much electricity each customer is using and what phase of service that customer is receiving. We can determine what changes need to be made based on projected customer use. GIS also helps with operational decisions, such as balancing load on the feeders."
An important part of the work at Carroll Electric involved data acquisition and cleanup. By making sure all utility data was as up-to-date and accurate as possible, Wynn is able to identify errors in the network before the information is handed over to the engineers.
"The data was all here; it was just in a hundred different places on paper," Wynn says. "One of the many reasons we chose GIS is because we wanted to maintain and update all facility data within one software system, as well as give everyone in the organization one source for viewing GIS information."
Now the GIS team at Carroll Electric can supply engineers with data to feed into an engineering analysis model based on technology from Milsoft Utility Solutions, an Esri Partner in Abilene, Texas. The engineers are then able to look at load balancing and system improvements based on forecast growth rates.
Growth rates are based on previous peaks, new service requests, and operational experience. The engineering analysis model is exported back to the GIS team for map production.
For planning and reporting, Carroll Electric relies on GIS-based maps that show how the company will accommodate load projection. With these maps, the utility is able to view and analyze customer usage, conductor length and size, phasing, and protection devices. The information helps determine system weaknesses, such as overloaded feeders, taps, and substation transformers. It can also be used to calculate voltage drop, determine whether certain customers experience low voltage during peak hours, and predict which protective device may potentially trip.
Reports created within the Milsoft application can justify new facilities by showing why and where a new substation is needed. GIS helps the utility manage and display report data in an organized structure, including information related to the current of the line at particular locations, voltage drops at certain line intersections, and the conductor size and age of older lines. This can be useful in analyzing which fix would be best when a number of options are available. GIS also can offer insight geographically, showing the utility which region might experience higher growth. Decisions for routing a conductor in an area near a lake or interstate corridor can be made based on right-of-way clearing, future patrolling, and potential growth.
Carroll Electric uses GIS to document plans and update as needed. Justification for funding involves economic analysis based on losses, projected load growth, and reliability on a new route versus an existing route.
For more information, contact Taylor Wynn, Carroll Electric Cooperative Corporation (e-mail: twynn@carrollecc.com).