Where the Wild Things Are in Yellowstone Park
A Science-Based Approach to Collaborative Decision Making at Ecosystem Scales
Highlights
- Ecologists use ArcGIS and a GeoDesign workflow to measure the impact of potential land-use change before it happens.
- Yellowstone scientists created an ArcGIS software-based ecological forecasting system.
- GIS lifts ecological issues from subjective opinion and polarization to a place where decisions are made using facts.
![]() The human history of the Yellowstone region can be traced back to an undesignated time in tribal oral history more than 11,000 years ago, when many groups of Native Americans used the park as their home, hunting ground, and source for gathering medicinal plants. These traditional uses of Yellowstone lands continued until the first explorers and trappers of European descent found their way into the region, recounting tales of a bountiful land full of natural wonders where "fire and brimstone" gushed up from the ground. In March 1872, President Ulysses S. Grant signed into law a congressional act making Yellowstone the first national park in the world, an area so extraordinary that it was set aside and protected in perpetuity for the enjoyment of future generations. Thanks to its early designation and protection, Yellowstone is one of the few remaining intact large ecosystems in the northern temperate zone of the earth.
The human history of the Yellowstone region can be traced back to an undesignated time in tribal oral history more than 11,000 years ago, when many groups of Native Americans used the park as their home, hunting ground, and source for gathering medicinal plants. These traditional uses of Yellowstone lands continued until the first explorers and trappers of European descent found their way into the region, recounting tales of a bountiful land full of natural wonders where "fire and brimstone" gushed up from the ground. In March 1872, President Ulysses S. Grant signed into law a congressional act making Yellowstone the first national park in the world, an area so extraordinary that it was set aside and protected in perpetuity for the enjoyment of future generations. Thanks to its early designation and protection, Yellowstone is one of the few remaining intact large ecosystems in the northern temperate zone of the earth.
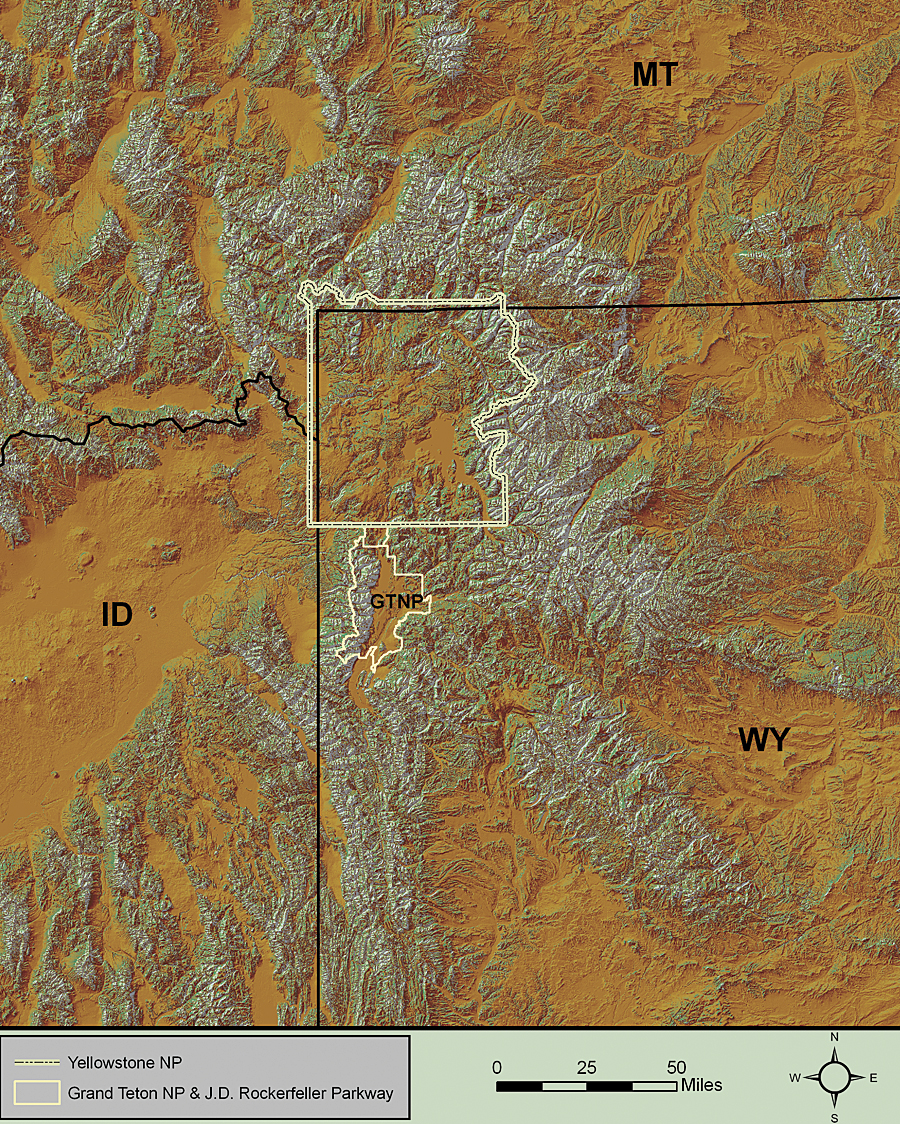
The greater Yellowstone ecosystem.
In recent years, managing these ecosystems has become increasingly challenging. Drought, wildfire, habitat fragmentation, contaminants, invasive species, disease, and a rapidly changing climate have begun to threaten human populations, as well as native species and their habitats. To plan for this uncertainty, a dedicated group of ecologists is using ArcGIS, statistical analyses, and a GeoDesign workflow to measure the impact of potential land-use change before it happens.
Ecological Forecasting
The Yellowstone Ecological Research Center (YERC), a private, nonprofit organization located in Montana, spends much of its time conducting long-term, large-scale, collaborative ecological research and education in concert with both public and private organizations. Historically, that work has relied heavily on ArcGIS to help organize, analyze, and visualize data on the health and status of native species and the land and water that sustain them.
Simulating ecological system dynamics is a complex undertaking. The sheer volume, variety, and complexity of geospatial data have grown exponentially in recent years, requiring the development of new tools and efficient workflows to help decision makers spend more time on the issues without having to sort through data. More importantly, decision makers need to be able to synthesize this data into standardized, transparent, and defensible information to support the management needs of today while preparing for the needs of tomorrow. And that means having a repeatable process, a core tenet of scientific inquiry.
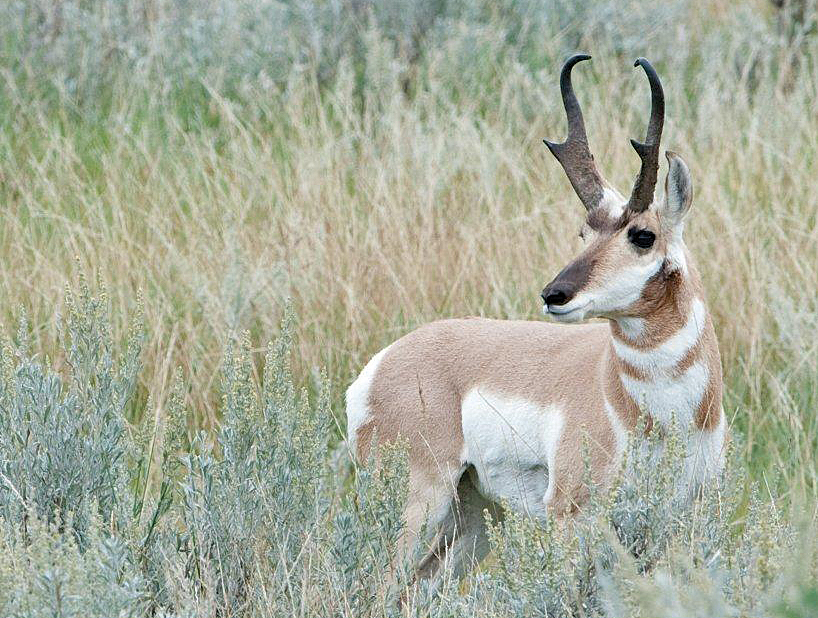
One of the park's pronghorn antelope (photo courtesy of Hamilton Greenwood).
To support the entire process of ecological forecasting, YERC ecologists, statisticians, and GIS analysts created the Ecosystem Assessment, Geospatial Analysis and Landscape Evaluation System, known as EAGLES, which is essentially GeoDesign at an ecosystem scale. EAGLES is an integrative workflow architecture that organizes vast amounts of historic spatial data, some covering the entire United States, with modeling routines to create predictive ecosystem and species models. ArcGIS is a key component of EAGLES, providing a mapping platform to make the data easily understandable to decision makers.
The workflow begins with the assembly of experts having a strong knowledge of the organism of interest, including physiological drivers, feeding habits, predator/prey relationships, competitive interactions, and habitat. Additionally, this effort can integrate pathogens, parasites, or other hazards. These experts help develop a conceptual model of key issues and management objectives. The conceptual modeling process begins with a verbal description of important relationships between the species of interest and its environment. The verbal description is then used to help select a set of hypothetical drivers to be considered for inclusion in the model. The environmental variables (i.e., covariates) and their relationship to the species of interest (i.e., response data) are referred to as a narrative model using a mind map (see chart below).
The Case of the Pronghorn Antelope
For example, the Yellowstone pronghorn antelope (Antilocapra americana) faces a suite of risks characteristic of small populations with geographic/demographic isolation, low abundance, and low recruitment. Decision makers need a management plan based on demographic monitoring of abundance, especially species vitality rates. This study focused on demographic monitoring, especially recruitment and survival; ecological interactions, especially predation rates and recruitment; and habitat assessment.
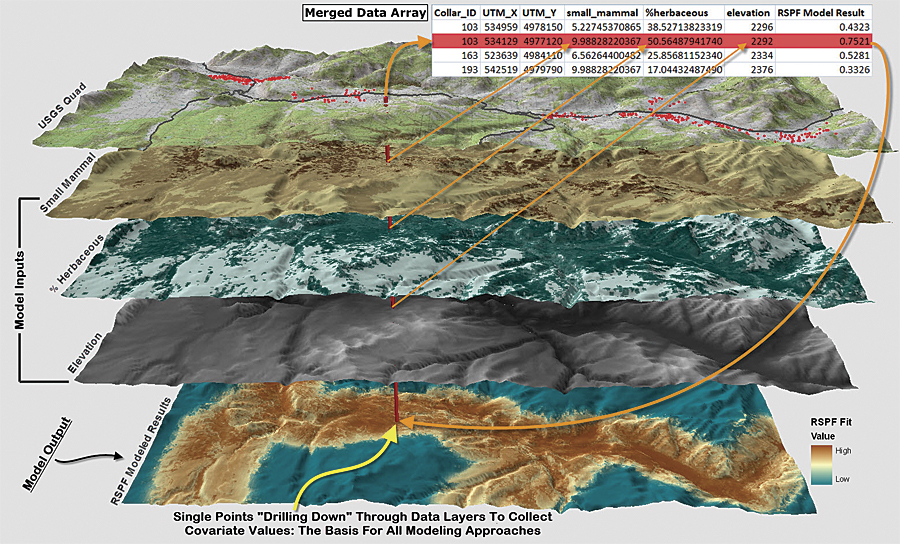
When all data is referenced in a common coordinate system, the referential link gives the scientist or manager the ability to investigate all the various interdependencies of a single point to all other data, increasing the efficiency and quality of the inquiry.
The issue assessment resulted in the creation of two narrative models, one representing birthing arenas and another for resource selection (involving the identification and use of viable habitats). In this case, species vitality could be explained by forage availability, predator intensity, geophysical context, and climatic variables. For example, the more rain, the more food, and the more newborns, the healthier the population might become.
Information Needs
Once the narrative models have been created, the next step is the identification and gathering of relevant datasets that could answer questions regarding road impacts, predator impacts, and range condition impacts on pronghorn antelope. A few of these datasets are elevation, topographic complexity, land cover, predation, and distance to roads.
In the case of the pronghorn antelope study, the species observations included 762 telemetry fixes from 26 collared animals from May to July of 2005. The spatial extent of the analysis was defined by this data in combination with expert knowledge of known habitat use. The spatial resolution for all environmental data was a 100-meter grid produced by resampling the data as appropriate.
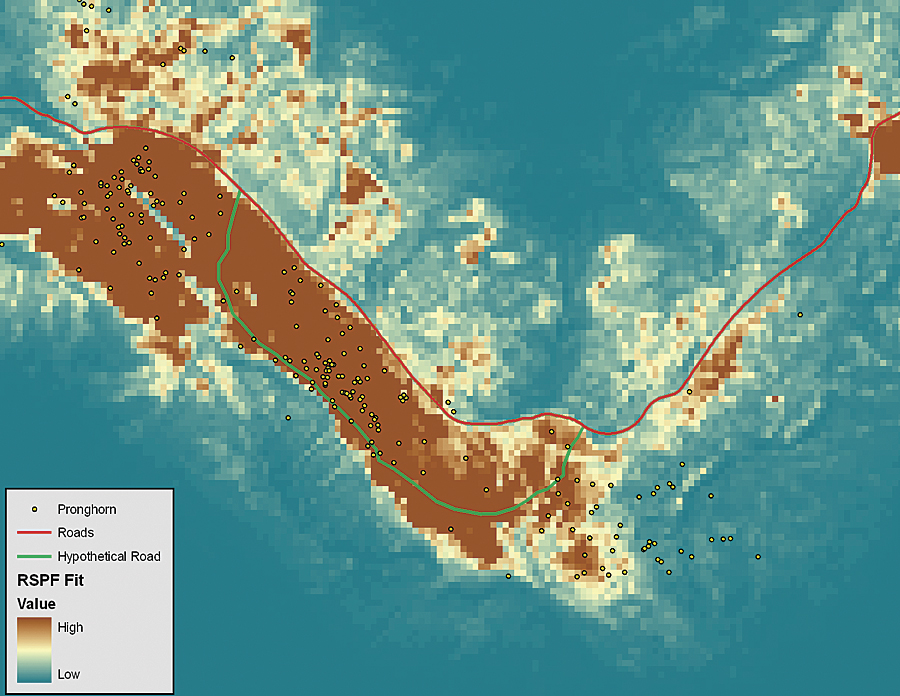
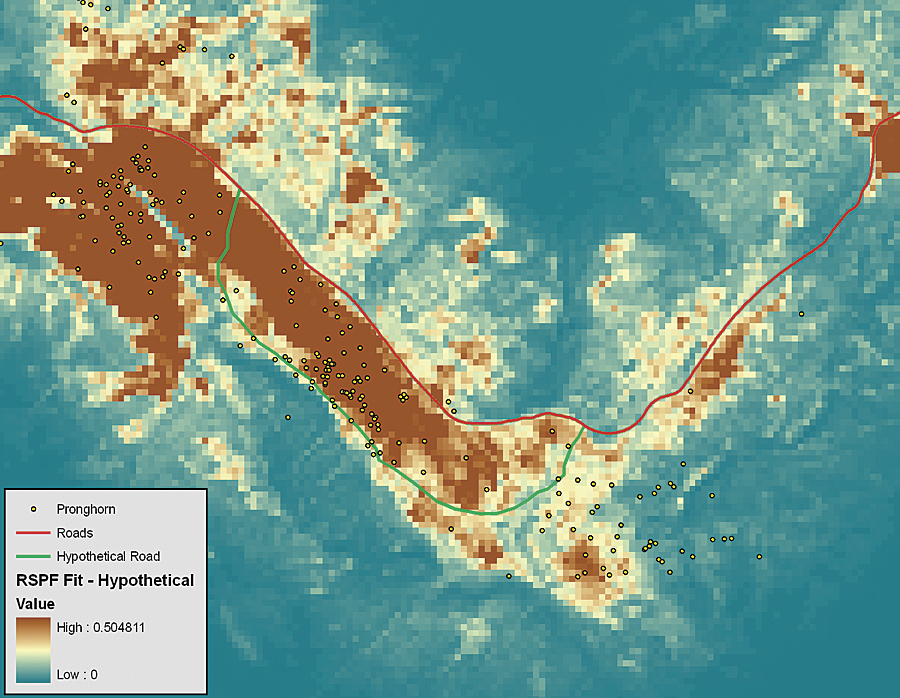
The map on the left displays a portion of the original resource (RSPF) model showing predicted habitat use for pronghorn in Yellowstone National Park. The Swap tool was used to apply the resource model to a hypothetical road addition (shown in green). The new prognostic RSPF model output for pronghorn (right map) indicates that pronghorn would be excluded from portions of their original selected habitats.
Analysts used various modeling techniques to create forage, herbaceous, sage, soil, and cumulative net primary production (NPP) layers (i.e., process models). Additional models using empirical field data created coyote and wolf intensity of use and small mammal biomass layers. Finally, available space layers were created using one-kilometer buffers around each pronghorn location in which points were randomly generated over that space to simulate potential habitat use. Since the spatial scale at which pronghorn select their habitat was unknown, this process was repeated at three kilometers and five kilometers for comparative analysis.
Examining Alternative Futures—Ecological Forecasting
EAGLES has a tool called the Swap tool that enables users to build alternative scenarios (i.e., change models) using an already constructed model and change only one attribute while holding all else constant to examine the effects of that change on the model. This approach allows a transparent investigation of the changes in levels of treatments, such as geophysical layer alterations, changes in forage availability, or more sophisticated modeled input layer substitutions. The goal is to apply a model that previously "fit" to observed data for a potential scenario in an effort to make projections about the ecological ramifications of a given landscape change (i.e., impact models).
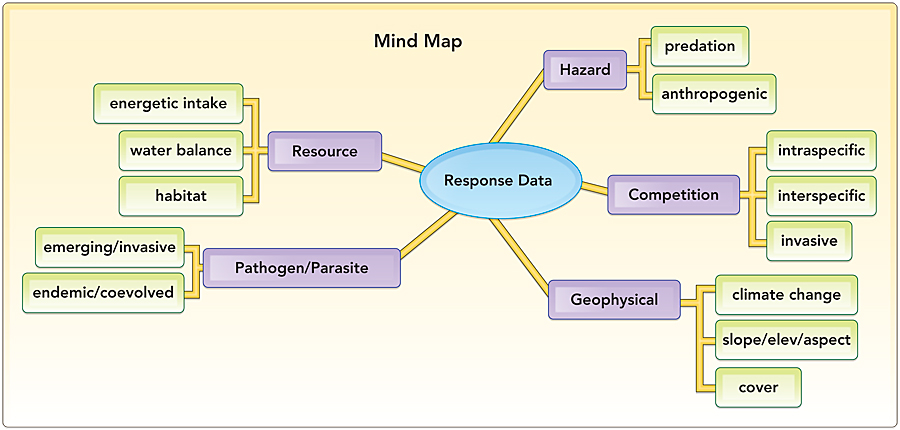
A mind map is a quick way to display potential factors affecting variation in a focal species response, for example, the health and vitality of a population. The mind map could be based on present-day data or legacy datasets, either of which helps visualize the narrative model, which can get rather complex. The narrative model will eventually be used to create a quantitative model to support statistical analytics, which occur later in the workflow.
For example, a forecast about the impact of building a new road through a habitat would rely on the input of a new layer that contains the proposed road. The user can then apply the fitted resource model to the new road layer (instead of the original layer) and view the response surface under the changed landscape. Such projections allow a measured assessment of habitat change. Visualization of the resultant surface occurs in GIS, and the resultant equations and models can be examined statistically, as well. The intent is to provide a utility for planning for landscape change.
Humans with Nature
The benefit of the EAGLES toolset is that it streamlines the finding, compilation, and integration of data by allowing the user to identify the geospatial data inputs, region of interest, scale, and a common data resolution—even a temporal resolution—to make it easier to assemble available national datasets into a common georeferenced coordinate system using ArcGIS. Applying such a workflow to standardized datasets across the United States would help propel the adoption of GeoDesign.
Finding solutions to major ecological challenges will require new ways of thinking. It is no longer humans against nature or humans in nature—it is humans with nature. Whether it's Yellowstone's pronghorn antelope, grizzly bear populations, or the collapse of Pacific Northwest salmon runs, science and GIS have lifted each of these issues—and many others like them—from subjective opinion and polarization to a place where decisions can be made based on facts.
For more information about the Yellowstone Ecological Research Center, contact Jennifer Sheldon (e-mail: sheldon@yellowstoneresearch.org) or Bob Crabtree (e-mail: crabtree@yellowstoneresearch.org) or visit www.yellowstoneresearch.org.
For more information on how to put GeoDesign into practice, contact Mr. Shannon McElvaney, Esri (e-mail: smcelvaney@esri.com) or visit esri.com/geodesign.