|
Project Reveals River's Likely Course
By Jed Fehrenbach
Editor's Note: Students in the GIS certificate program at Cypress College in Cypress, California, are required to choose and develop a project over the course of four classes or one year. Near the end of the fall 1999 semester the author began a project to determine the most likely flood path of the Santa Ana River within the South Coast Basin of California and to find out which areas are at the highest risk of flooding.

| |
The Santa Ana River was once considered one of the most dangerous rivers in the United States.
|
|
|
The Santa Ana River, with a watershed area more than 2,500 square miles, was once considered one of the most dangerous rivers in the United States in terms of flooding. Collecting water from the arid region of Southern California, the river exits through a narrow canyon into the heart of one of the country's most densely populated areas, Orange County. Over the past 100 years, the Santa Ana River has caused several floods in Orange County, including a 500-year flood at the turn of the 20th century. All of these factors provided an opportunity to do some interesting research using GIS.
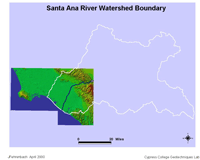
After deciding on this project, the first step was to collect the necessary data. This proved to be a challenging task for a beginning GIS student. The study was focused on a portion of the Santa Ana River near the Prado Dam in Corona, California, approximately 40 miles east of Los Angeles. Available data resources for this area included the Esri sample data and free data provided by the United States Geological Survey (USGS) over the Internet. The data included with ArcView GIS provided streets, political boundaries such as cities and ZIP Codes, and points of interest such as schools and hospitals. The Santa Ana Watershed Project Authority (SAWPA) supplied a watershed boundary shapefile. The course of the Santa Ana River was digitized from a large-scale map as a polyline using PC ARC/INFO 3.5.2. It was then converted to a shapefile. The USGS digital elevation model (DEM) data provided a basemap for the project.
DEM data is a raster data set that represents the surface of the earth. Using the ArcView Spatial Analyst extension, DEM data can be converted to grid data that contains information on elevation. Hydrologic and flooding analysis requires elevation data in grid format. The DEM data used for this project had 10-meter accuracy and was in Spatial Data Transfer Standard (SDTS) format. After data has been downloaded from the USGS site, it must go through a series of steps before it is viewable and usable. These files come compressed in an archive with a .tar.gz extension. WinZip, a program for Windows 95/98/2000 and Windows NT, can be used to unzip files with a .tar.gz file extension. Once unzipped, the DEM actually becomes a group of files within a folder. With the ArcView Spatial Analyst 1.1 extension loaded, choose File > Import Data Source and then choose USGS DEM in the Select Import File Type dialog to add DEM data to a project.
Problems occurred when projecting all of the data into the same view. Since ArcView GIS cannot change the projection of grid data, the other shapefiles in the project were reprojected. Metadata for 7.5-minute DEM data indicated the DEM data was in Universal Transverse Mercator (UTM) projection based on the WGS 84 datum. The script extension known as Projector! allowed the projection of the Esri data, the watershed boundary, and the river polyline, from a geographic coordinate system (latitude/longitude) to UTM, WGS 84. Once this was done, the shapefiles aligned with the DEM grid perfectly.
Hydrologic Modeling v 1.1, a sample extension that comes with ArcView Spatial Analyst, creates watersheds and stream networks from DEM data, calculates physical and geometric properties for watersheds, and aggregates these properties into a table that can be attached to a grid or shapefile. After filling sinks in the DEM, Flow Direction, a tool included in this extension, was used to determine the least-cost path or path of least resistance for water traveling across terrain. Flow Direction calculates the least-cost path by examining the eight grid cells surrounding the chosen cell and selects the adjacent cell containing the least value. This least value has the greatest and nearest elevation drop and would therefore be the direction in which a drop of water would travel. The process repeats until the drop of water has reached the lowest point.

| |
Applying the Flow Direction tool yielded surprising results.
|
|
|
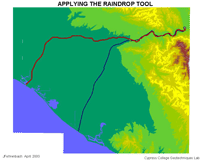
Applying Flow Direction at the Prado Dam yielded surprising results--a hidden flood path that travels due west across north Orange County into Los Angeles County before turning southward through the Long Beach area and emptying into the Pacific Ocean. This path differs greatly from the cement channel for the Santa Ana River in Orange County. Wayne Engstrom, professor of Geography at California State University at Fullerton, and Ann Johnson, a geomorphologist currently with Esri, are two of many scientists in the fields of geology and geomorphology who have validated this discovery. The least-cost path of the river is actually a channel that was used by the river in the 19th century. This path is shown on historic maps.
This project, which determined the most likely flood path in the event of future catastrophic floods, demonstrates that the analytical tools available in Esri's desktop GIS software can be used with readily available data to perform valuable analysis.
[Editor's note: Grid Projector, an extension created by Kenneth McVay, will reproject grid data. This extension, along with additional information on using USGS data in ArcView GIS, is available from the ArcUser Online Web site on the "Terrain Modeling with ArcView GIS" page. Shapefile data can also be reprojected by using the Projection Utility that comes with ArcView GIS 3.2.]
About the Author
Jed Fehrenbach is a geography student at Cypress College. He has worked as a technical and instructional assistant on GIS Access, a National Science Foundation Advanced Technological Education (NSF ATE) grant project and has also been a technical and instructional assistant for C3GIS Web resource development. He currently works as an intern for the Cypress College California State Chancellor's authorized GIS technical certificate program. He won the American Association of Geographers' Community College Student Academic Paper Award for 2000.
Resources
Maidment, David and Dr. Dean Djokic. Hydrologic and Hydraulic Modeling Support with Geographic Information Systems, Esri Press: Redlands, California, 2000. This title is available from the GIS Store..
|