|
New Color System Enhances Relief Maps
By Jim Mossman, Data Deja View
The ShadeMax Color System is a set of color palettes and legends that significantly enhance shaded relief maps produced with the ArcView Spatial Analyst and ArcView 3D Analyst extensions to ArcView GIS. These palettes can be customized to meet individual terrain mapping needs. While primarily created to portray elevation for maps created from digital elevation model (DEM) data, concepts used in its development can be applied to any mapping situation that uses ArcView Spatial Analyst or ArcView 3D Analyst with continuous data.
 |
|
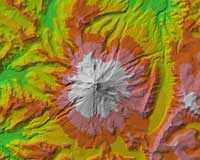
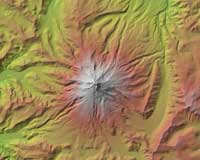
The default elevation color ramps produce noticeable banding. The ShadeMax palette gives the illusion of a continuous change in color.
|
|
|
ShadeMax is available at no charge from the ArcScripts pages of the Esri Web site. This article describes how and why ShadeMax was developed and gives some tips on using its components. Unless otherwise noted, the accompanying illustrations show the Mt. Hood area of Oregon. The source data included 12 7.5-minute, 30-meter DEMs downloaded from the United States Geological Survey Web site.
Continuous Elevation Colors
The standard method for coloring shaded relief in Spatial Analyst and 3D Analyst has been to use one of the color ramps that come with ArcView GIS such as Elevation #1. These ramps are discrete color sets with very noticeable color demarcations. The core concept that led to the development of ShadeMax is that elevation is continuous data and can best be portrayed with a color set that gives at least the illusion of a continuous change in color as elevation changes.
In early 1998 the author developed a test palette of 48 light, closely spaced colors that was initially tested at the Vermont Agency of Transportation with very acceptable results. This test palette, SM08vermonter.avp, became the first component of the ShadeMax color set. Using seemingly continuous color versus discrete color sets for portraying elevation noticeably enhanced the visual effect.
Matching Color in Spatial Analyst and 3D Analyst
It can be difficult to match the colors generated using the hillshade feature in Spatial Analyst with a representation of the same area displayed in 3D Analyst without introducing undesirable visual effects. ShadeMax provides some solutions to this problem. To understand how to best use these solutions, it is desirable to understand a little about how Spatial Analyst and 3D Analyst work with light. The following discussion is based on observations made while using these two extensions rather than any knowledge of the theory behind the development of these extensions or the code used to produce them. However, these models appear to adequately serve as a framework for describing both the problems encountered and the solutions suggested.
Hillshade Behavior
Hillshading in Spatial Analyst results from the program evaluating the aspect and slope of the terrain relative to the sun's azimuth (the sun's location on the horizon) and sun's altitude (the sun elevation above the horizon). The shadowing effect of adjacent terrain is also used in generating a hillshade. The shadow direction is affected by the sun's azimuth setting and shadow length is affected by the altitude component.
Regardless of the colors applied to the hillshade theme, when a hillshade is used as a brightness theme for another theme to produce a relief map, the hillshade is applied with grayscale values. In terms of the hue, saturation, and value (HSV) color model, grayscale colors have a hue of 0 and a saturation of 0. Grayscale values range from 255 for white to 0 for black with gray making up the middle values.
Shaded relief in a hillshade is constructed by adjusting the value component of a grid theme's cell colors in proportion to the values of the related brightness theme cells. The amount of this adjustment is controlled by the minimum and maximum cell brightness settings that can be modified using the Advanced Options menu in the Legend Editor. The sun's altitude setting also has an effect on overall theme brightness, but this effect is very slight. Brightness settings can take complete control of the value portion of a color. Thus the user may end up with hillshade colors that are vastly lighter and/or darker than those specified with the Legend Editor for the grid theme.
| |
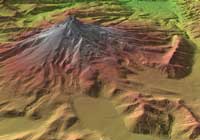
Lowering the sun's position darkens the colors in a hillshaded image.
|
|
|
Illuminate Faces in 3D Analyst
The process used in 3D Analyst to give the effect of hillshading is called illuminating faces. The illumination behavior model has significant differences from hillshading in Spatial Analyst, though with both there is a slight amount of shading that is independent of the sun.
A major difference between these two methods of giving a hillshading effect is that illumination does not generate shadows. It does not show the effect of terrain that may block light from the sun. Instead, an equal change in color value is made for all the TIN faces (triangles) with the same angle relative to the sun. The brightest colors appear where the sun's angle is perpendicular to a triangle's surface. As the angle that sunlight strikes a face moves away from the perpendicular, darker color values are generated. Lowering the sun's azimuth also increases the contrast between light and dark areas. These areas of contrast that may appear as shadows really result from triangles with markedly different slopes.
| |
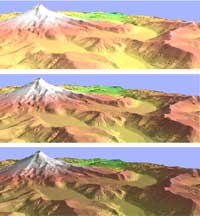
As the angle of the sun striking a 3D face changes from perpendicular, darker color values are generated. This series shows the sun at 45, 30, and 15 degrees.
|
|
|
Another major behavior difference is that in 3D Analyst, sun angle changes override color values to a lesser degree than typically occurs with cell brightness changes in Spatial Analyst. For example, even at a very high sun angle, palette colors with low value components will not be brightened as much as the same colors would in Spatial Analyst with high cell brightness settings.
ShadeMax: A Color Solution
To address the problem, two more color groups were added to the SM08vermonter.avp palette. These two groups were created by copying the original colors and then lowering most value components by approximately 22 percent and 39 percent. ArcView GIS layouts with three-dimensional images generated using these color groups were shown in a cartography session at the 1999 Northeast User's Group Regional Conference. The audience agreed that these new color groups helped match Spatial Analyst and 3D Analyst colors and recommended adding another color group with values somewhere in between the values in the two new groups.
Consequently another color group was created using value components lowered by about 29 percent from the original. This may well turn out to be the most useful color group for 3D Analyst as it enables ShadeMax to solve the Spatial Analyst to 3D Analyst color match problem. By starting with a palette for 3D Analyst that more closely resembles the results obtained in Spatial Analyst, only minor adjustments in sun azimuth and elevation are necessary. These minor adjustments do not introduce undesirable shadow and/or contrast effects. When both Spatial Analyst and 3D Analyst maps are used in the same presentation or publication, using closely matched colors gives a much more pleasing result.
Legend Problems and Solutions
The colors in a default legend generated by Spatial Analyst for a hillshade theme usually do not match the theme colors well because the legend uses the palette colors without modification while theme colors may be radically altered by the value changes induced with cell brightness settings. An elevation legend would be more effective if it contained representative theme colors for both light and dark (shadow) areas.
With this in mind, a custom legend was constructed using the line and box drawing tools in ArcView GIS. Various combinations of the new color groups were used for fills in the light and dark portions of the legend boxes. This resulted in the creation of a fourth new color group for use in light portions of the legend. This group had value components lowered by only 8 percent. The initial construction of the custom legend required some effort. However, once completed, changing the colors to emulate a particular elevation theme's colors is not too time consuming and the results seem to justify the extra work. The ShadeMax color set includes an ArcView GIS project for use with version 3.1 or 3.2 that contains a layout with several custom legends and instructions by the author. These are templates to jump start users in creating Spatial Analyst and/or 3D Analyst legends for specific needs.
Letting Color Do More Work
The final ShadeMax concept addresses using color not just to represent changes in elevation, but also to indicate additional characteristics of the area being mapped or modeled. Color can be used to hint at the nature of the terrain. This work was an offshoot of experiments with limiting colors for elevation palettes in order to leave a wide range of other colors for depicting point and line features. Several excellent suggestions resulted from volunteers testing those early palettes. Additional new color sets were created in preparing exhibits for the 2000 Esri International User Conference Map Gallery. Using these palettes on the same data demonstrated that different color groups can make data look radically different and imply not only elevation changes but also vastly different environments and times of the year.
The End Is Only the Beginning
The initial ShadeMax set was posted to the ArcScripts site in February 2000. It was significantly updated in September 2000. The color groups were rearranged into a more useful order and additional palettes were added. While this aspect of ShadeMax development has concluded, it signals the beginning of the real development process. The ShadeMax Color System provides a basic color tool set for use with Spatial Analyst and 3D Analyst that includes many ArcView GIS 3.x palettes and legends. The author hopes users will extensively customize these palettes and legends to meet their own mapping needs as part of an ongoing development process. Using this tool set and the basic ShadeMax concepts, users can create innovative solutions to cartographic challenges. The author hopes that these users will also share their results with the author to help improve the ShadeMax Color System for everyone. Contact the author at jmossman@wcvt.com.
About the Author
Jim Mossman worked for many years in the Vermont State government assisting a number of departments in the use of data processing from the early days of punch card machines up through mainframes to CAD and GIS systems. Working now as Data Deja View (DDV), he has created and shared an extensive collection of ArcView GIS and ArcInfo marker symbols as well as color sets through the Esri ArcScripts site. Some of the color palettes he developed ship with ArcView GIS 3.2.
|