ArcUser Online
Revisiting the Glenrosa Fire
Evacuation modeling with ArcGIS Network Analyst 10
By Mike Price, Entrada/San Juan, Inc.
What You Will Need
- ArcGIS Desktop 10
- ArcGIS Network Analyst 10 extension
- Sample dataset downloaded from ArcUser Online
This article as a PDF.
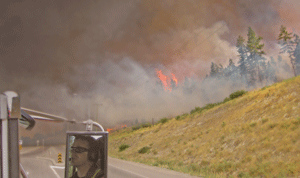
On July 18, 2009, a small wildfire in the hills west of Glenrosa, in southeastern British Columbia, quickly spread and necessitated the evacuation of approximately 3,000 homes.
On July 18, 2009, at approximately 2:30 p.m., a small wildfire started in wooded hills west of Glenrosa, a neighborhood in West Kelowna, located on Lake Okanogan in southeastern British Columbia—an area that has seen its share of wildfires.
Pushed by 37 mph winds, the fire spread quickly to the Glenrosa neighborhood, and the residents of approximately 3,000 homes were quickly evacuated. An evacuation center was established at Royal LePage Center, a large civic complex next to the West Kelowna City Hall. In the five days required to contain it, the Glenrosa/Gellatly fire burned more than 900 acres and damaged or destroyed several homes. At its height, the fire caused the evacuation of more than 11,250 residents.
This ArcGIS 10 exercise shows how the ArcGIS Network Analyst extension can be used to identify, accumulate, and route an at-risk population from homes or workplaces to safety. This exercise walks the reader through assessing the evacuation potential of over 1,000 homes in the Glenrosa neighborhood and testing evacuation options using the actual Glenrosa/Gellatly fire footprint. Had the fire expanded only slightly, the entire community would have become cut off from safety. To respond to this scenario, the exercise will test a hypothetical "back door" that might allow evacuation of many residents directly away from the advancing fire.
Part 1: An Overview of Evacuation Modeling with ArcGIS Network Analyst
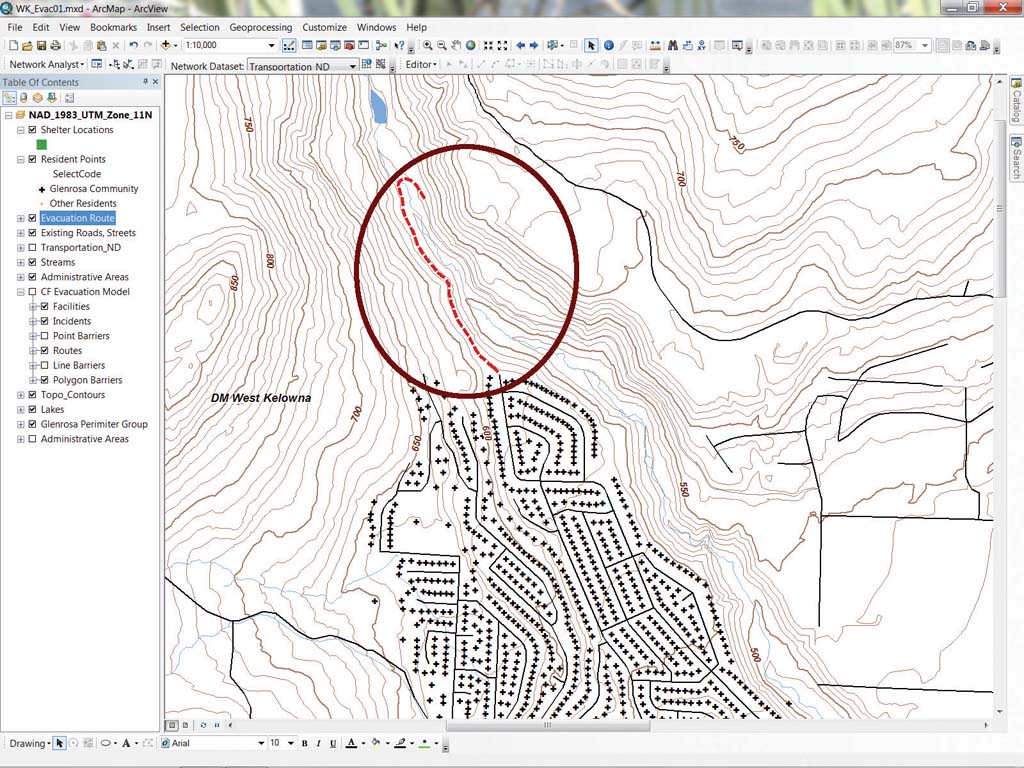
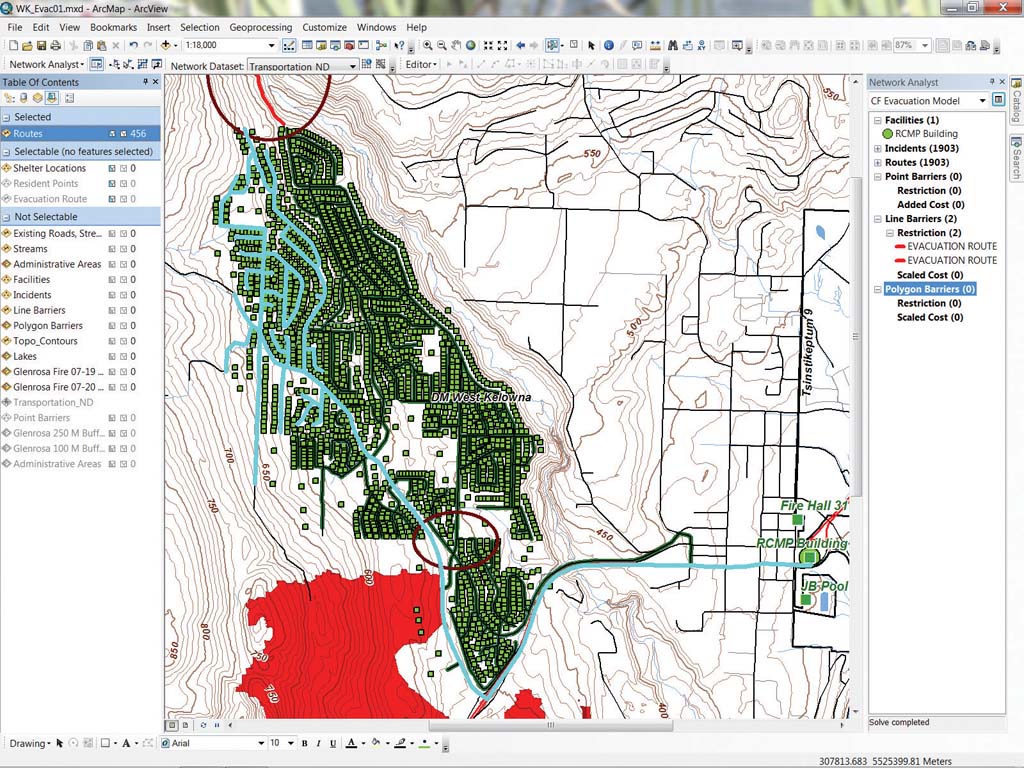
This is one of the two ovals on the map that highlight critical parts of the model. They will be used to refine the evacuation plan.
Time-based evacuation modeling is a key component in any community disaster plan that requires assembling and relocating many residents to safe areas or having them simply leave their homes and workplaces. Because evacuations typically involve coordinating the actions of private citizens who may or may not be well informed, are traveling primarily in private vehicles, and are responding to an immediate or near immediate event, successful outcomes depend on careful planning, proper notification, and safe and timely community response. Defining, understanding, and anticipating traffic behaviors are key to a safe and efficient evacuation.
ArcGIS Network Analyst is an excellent tool for mapping and modeling time- and distance-based travel. Network Analyst's Closest Facility (CF) solver connects evacuee points with identified shelters or egress points and calculates the optimal time and distance for travel by many evacuees to one or more safety points. Roads blocked by fire, flooding, wind damage, and other obstructions may be modeled. Multilane routes can be modeled to include both responding and evacuating traffic. Analysis identifies high-volume and restricted intersections and where traffic may be managed by traffic control or by diverting certain evacuees to an available secondary route.
The ArcGIS Network Analyst Closest Facility Solver
In the table of contents, right-click the CF Evacuation Model, select Properties, and open the Analysis Setting tab to verify that travel is set from incidents to one facility and no time cutoff has been applied.
The Network Analyst extension contains several robust solvers that allow emergency service modelers to map and model many time and distance travel issues. The CF solver was designed to locate the closest service or care facility to a specific event. For example, in response to an automobile accident (i.e., Incident), a patient may require transport to a hospital (i.e., Facility), and a towing company may be needed to remove damaged vehicles from the scene. The CF solver maps the accident location and searches for one or more nearby medical facilities using a travel time solution. Because the services of a tow truck are not time sensitive, the CF solver might identify facilities based on the shortest travel distances from the accident.
To model evacuees with the CF solver, the evacuated households and other occupancies become the Incidents, and the evacuation centers, outside gates, or other points of egress become Facilities. If several shelters or gates are available, all evacuees may be modeled using several destinations. The solver returns an arrival time, arrival order, and distance traveled for each evacuee at one or more destinations. In ArcGIS 10, point, polyline, and polygon barriers may be used to restrict and reroute travel to simulate the effects of roads closed as a result of flooding, wildfire, earthquake, toxic plumes, or other adverse conditions. In addition to routing, the solver also identifies residents who may become trapped if the area involved in the Incident expands.
After checking the properties for the CF Evacuation Model, right-click it in the TOC and choose Solve.
Preparing Input Data
Time-based travel modeling requires accurate, current, complete street datasets that have been properly designed and prepared. Street datasets must perform predictably in a network modeling environment and include proper impedance values (for speed and distance), connectivity, directionality, crossing geometries, and turn modifications. For more information about network streets, read "It's All about Streets: Tips and tricks for obtaining, building, and maintaining time-based network streets" in the Fall 2009 issue of ArcUser (bit.ly/c84qLc). If possible, compare streets to current aerial imagery and check alignments for accuracy, completeness, and connectivity. Imagery also aids locating and counting individual occupied structures or when mapping obscure, often private access to houses.
Next, identify the residents likely to be evacuated and locate them on a map. For existing residents, the county assessor's parcel map and actual building footprints are very helpful. If you have good aerial imagery but no building polygons, you can add residence points to individual structures. As Census 2010 block-level data becomes available, rooftop dwelling counts can be verified. If the community has performed community-level mapping and a structure vulnerability assessment, include this information, too.
Using the Select By Polygon tool shows an accumulation of 456 residences evacuating on Glenrosa Road just below Country Pines Gate.
Future populations at risk may be derived from development plans, neighborhood as-built drawings, and population projections from growth plans. Proposed transportation corridors will come from transportation plans and growth management information. Add these corridors to a separate version of the primary street network or include them as a separate feature class included in a transportation feature dataset maintained in a file geodatabase.
Shelter capacity and shelter opening requirements must be determined and mapped. Many local and regional emergency response plans identify and describe evacuation shelters and the evacuation corridors leading to them. If possible, incorporate values for the carrying capacity of evacuation corridors into the street dataset. Locate and describe alternate shelter sites to accommodate both anticipated and unexpected changes in the development of an Incident. Define natural and man-caused hazards and risks in the community and include them in the study.
| Data Sources for Evacuation Candidates | |
|---|---|
|
Existing communities |
Proposed development |
|
Census block-level data |
Site plans |
|
Assessor parcels |
Tentative tract maps |
|
Residence counts based on use class, zoning designation, building footprints, |
Estimated points |
| Data Sources for Network Streets | |
|
Existing communities |
Site plans |
|
Local jurisdictions |
Tentative tract maps |
|
Commercial streets |
Estimated centerlines |
|
Proposed development |
|
| Data Sources for Evacuation Destinations and Shelters | |
|
Existing communities |
Proposed development |
|
Site plans |
Local or regional jurisdiction(s) having authority |
|
Emergency response plans |
Tentative tract maps |
|
Local or regional mapping datasets |
Estimated locations |
| Data Sources for Evacuation Hazards | |
|
Recognized hazards |
Anticipated hazards |
|
Local or regional jurisdiction(s) |
Modeled natural hazards (slope, vegetation/fuels, |
|
Emergency response plans |
Transportation concerns (roads, bridges, terrain, blockage) |
|
Local or regional mapping datasets |
|
Table 1. Sources for data
Finally, develop a community notification and communication network. Inform residents of the notification procedures, the primary egress routes, and locations and capacity of alternate shelters.
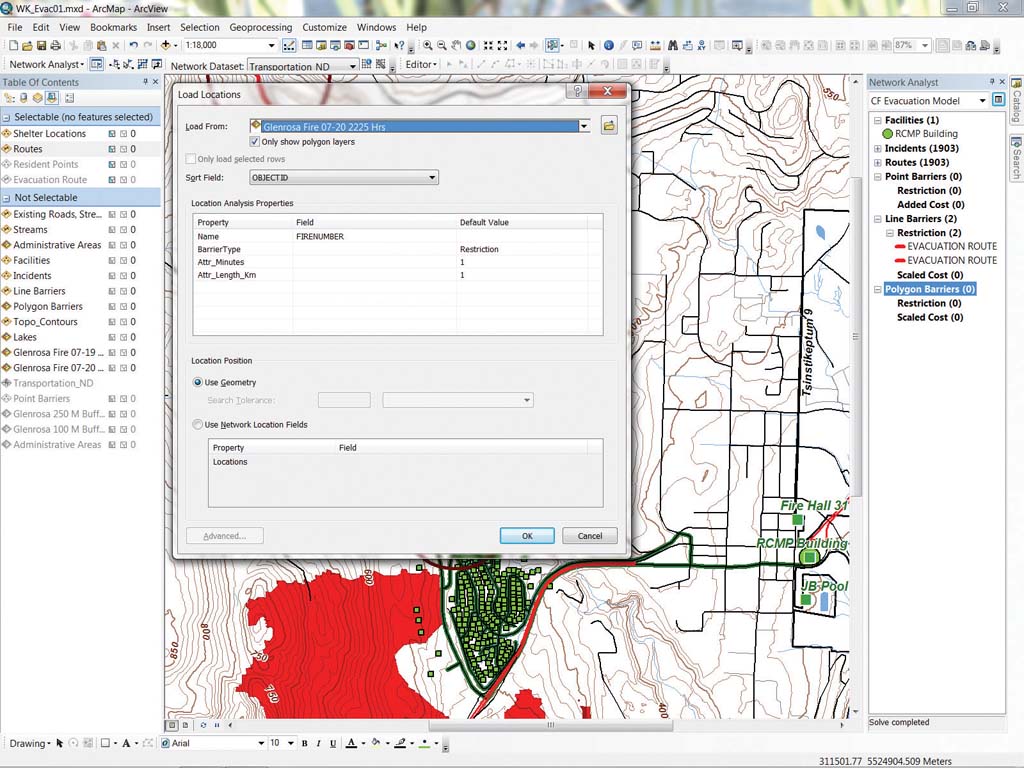
In the Network Analyst Window, right-click Polygon Barriers and choose Load Locations. Load locations from Glenrosa Fire 07-20-2225 Hours and set the Sort field to OBJECTID and the Name field to FIRENUMBER.
The Closest Facility Solver
After obtaining, standardizing, and mapping the data listed in Table 1, build a preliminary evacuation model. First, create an ArcGIS network and test it for connectivity and performance. Next, add evacuation shelters and/or egress portals to the map. Finally, add residence points. Each point represents an occupied structure, not an individual or vehicle. If available, add commercial or institutional facilities with attributes describing their occupancy.
After loading all input data, construct an initial CF solver. Shelters and egress points are loaded as Facilities, and the occupied structure points are loaded as Incidents. Multiple potential facilities may be modeled, routing evacuees to closest and alternate destinations. Set the travel direction from Incidents to Facilities. For most evacuation models, do not specify a maximum travel time. The CF solver is now ready to run; egress routes for the street network can be constructed, and travel times and distances can be accumulated along those routes.
Inspect and verify the preliminary results. A large model with many residences and multiple egress points requires some time to run, so be patient. Once completed, you can inspect and count the number of evacuees using specific egress routes. Using procedures presented in a future article, you may join and tabulate and superimpose stacked evacuation routes on the underlying street dataset and apply polyline symbols of varying width and color to represent the accumulation of evacuees along assigned routes. Stacked routes at street intersections may be summarized to provide counts of all vehicles that will pass through specific intersections. If certain routes or intersections are overloaded, secondary evacuation routes may be assigned to selected evacuees. Routes and intersection events may be recounted, certain evacuees can be redirected to alternate routes, and the model can be run again.
If you add closed or restricted egress to the model, save and replicate this CF model as a base case. In ArcGIS 10, you can add point, polyline, or polygon barriers that represent road closures or blockages. New in ArcGIS 10, polygon and polyline barriers can include fire progression shells, expanding flood areas, and mobile toxic plumes. You can run multiple copies of the CF model to test the effect of an expanding or moving hazard.
Resolve the model and inspect the Lower Glenrosa evacuation route. How many evacuees use this route now? How many use Glenrosa Road?
Part II: Revisiting Glenrosa
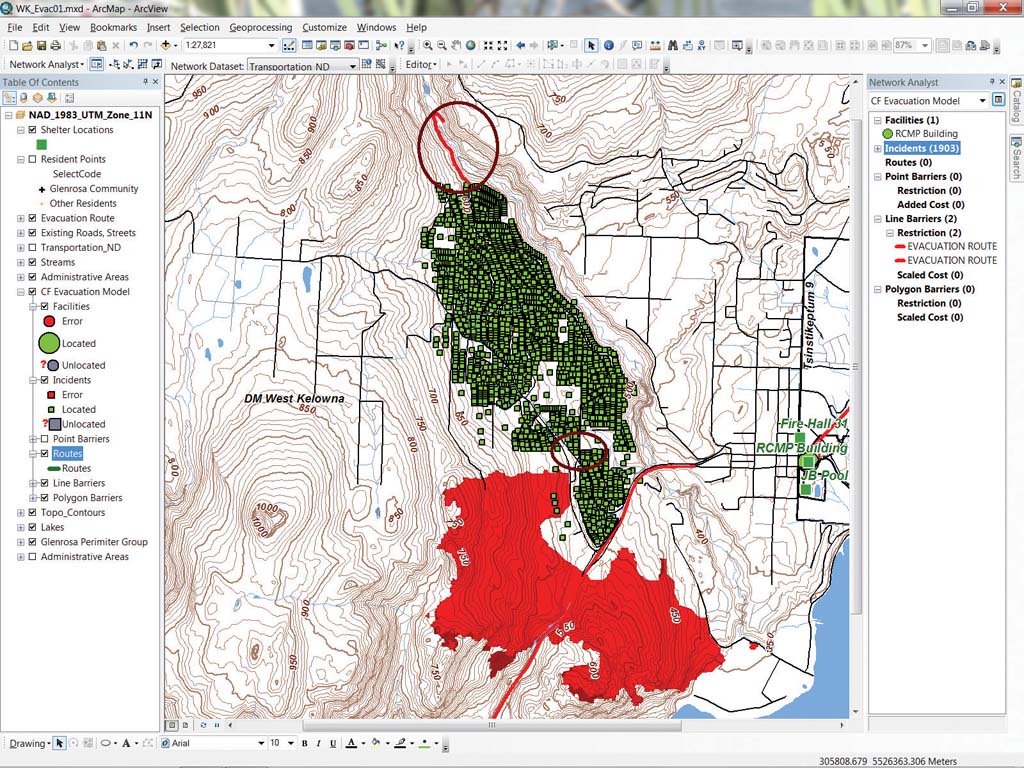
To begin this evacuation modeling exercise, download and unzip training data from ArcUser Online locally. Start ArcMap 10, navigate to the \WK_Evacuation folder, and open WK Evac01.mxd. Notice the many Residence Points within the Glenrosa neighborhood and the three Shelter Locations near the lake. The ultimate destination for evacuees will be the Royal LePage Center located approximately 3 miles east of the RCMP Building, so the RCMP facility will be used as the preliminary destination.
In the table of contents (TOC), inspect the CF Evacuation Model. For readers who are new to ArcGIS Network Analyst, the author has created a composite Network Dataset and initiated a CF solver. No Facilities (Shelters) or Incidents (Residences) are included in the solver; these will be added during the exercise.
- In the TOC, right-click CF Evacuation Model and select Properties. Review the Analysis Setting tab and notice that Incidents are only routed to one Facility and there is no time limit.
- Open the table for Line Barriers. There are two records. These lines block the proposed evacuation route.
- Inspect the three Shelter Locations and the Resident Points. The RCMP Building will be a destination staging area where evacuees will be sent before going on to the Royal LePage Center located a little more than 3 miles to the east.
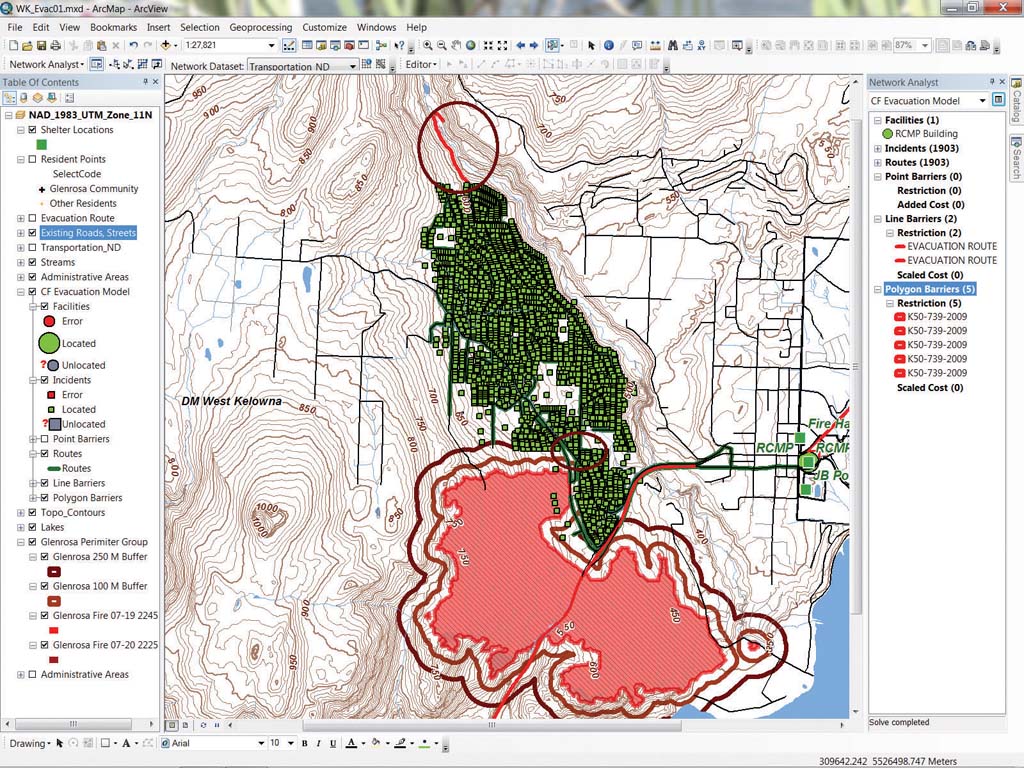
This model includes 1,903 Glenrosa residences that were separated from other residences with a definition query. Residences, not occupants or vehicles, will be counted. Notice the ovals in the north and south, which will be used to highlight critical parts of the model. - In the TOC, make the Glenrosa Perimeter Group visible. This group contains perimeters for the evenings of July 18 and July 19 and two buffers for the July 19 perimeter. These will be used to refine the evacuation plan. Note that the fire burned right up to Glenrosa Road, the major access road for the community. If this road was blocked, evacuation could become very difficult.
- Switch from layout view to data view, the view in which modeling will be performed. With the Glenrosa perimeter visible, zoom in to the southern ellipse, an area where blocking just two roads—Glenrosa, Webber, and Lower Glenrosa Roads—will isolate all residents north of this area. Using the Measure tool, determine that it is less than 250 m from the July 19 perimeter to the center of this critical area.
- Now, zoom north to the second ellipse. The dashed red line represents a proposed secondary route in and out of the community. This hypothetical route will be used to test evacuation options if the southern route is blocked. Zoom back out using the map document bookmark WC 1:25,000.
- Verify that Network Analyst is available and load its toolbar. Open the Network Analyst window and dock it on the right side of the interface.
Loading Shelters and Residences and Running a Prefire Model
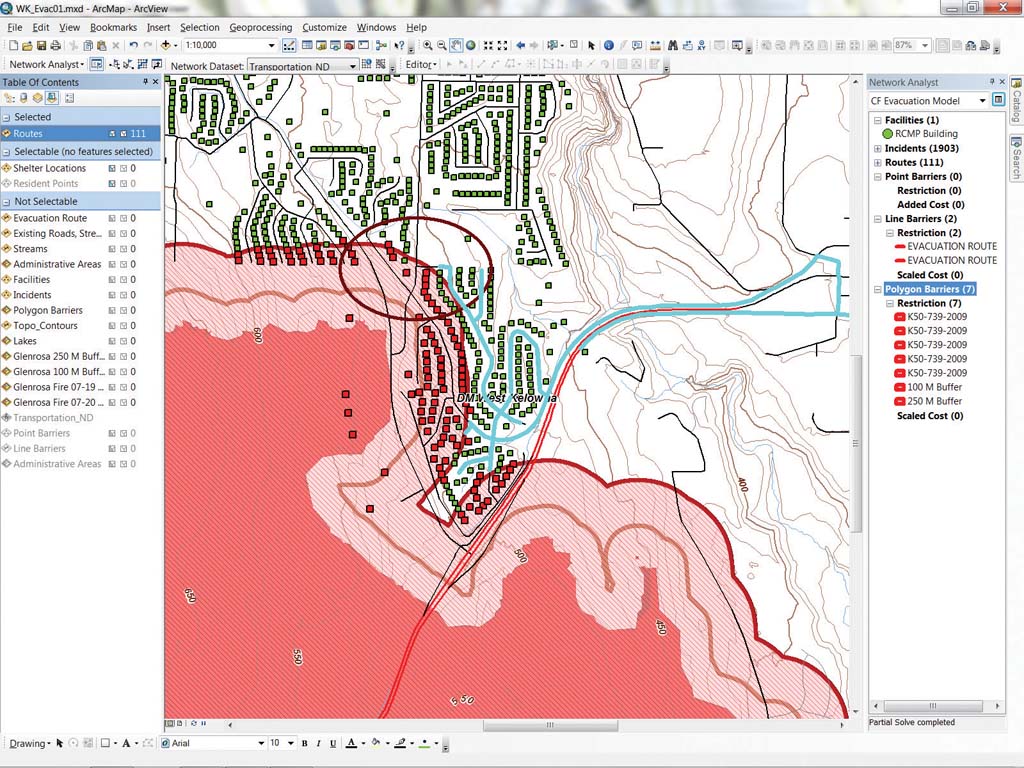
After adding the Glenrosa 250 M Buffer, only 111 residences can evacuate, and 1,792 residences are threatened.
- In the Network Analyst window, right-click Facilities and select Load Locations. Load from Shelter Locations, select Index as the Sort field, set the Name to Label, and note the tight search tolerance of 0 meters. Click OK.
- Right-click Incidents in the Network Analyst window and load the Glenrosa residences as Incidents from Residence Points. Set both the Sort field and Name to Index. Check the map and save it. Multiple iterations of this solver could be used by copying and pasting the original solver back into the TOC, renaming each copy. However, this exercise will modify just one solver.
- In the TOC, locate the CF Evacuation Model and make Line Barriers visible. These lines are the current blocks on the proposed northern egress. Right-click the CF solver, select Properties, and open the Analysis Setting tab. Verify that travel is set from Incidents to one Facility without a time cutoff.
- Close Properties and solve the model. Right-click the CF solver in the TOC and choose Solve. Close the warning message after reading it. After the solver has finished working, inspect the results and save the project.
- To quickly count evacuee routes, switch the TOC from List By Drawing Order to List By Selection. Make only Routes, Shelter Locations, Residences, and Evacuation Routes selectable and use the Select By Polygon tool to move to a location anywhere in the network to create a small selection box across the evacuation routes leading toward the shelter.
- In the TOC, look at the count of routes that have accumulated. The count shows an accumulation of 456 residences evacuating on Glenrosa Road just below Country Pines Gate and 217 houses being evacuated from Herbert Road, about 0.7 km west of the RCMP Building. Testing just west of the RCMP Building should show that all 1,903 residents can safely reach the shelter.
Loading Polygon Barriers and Resolving
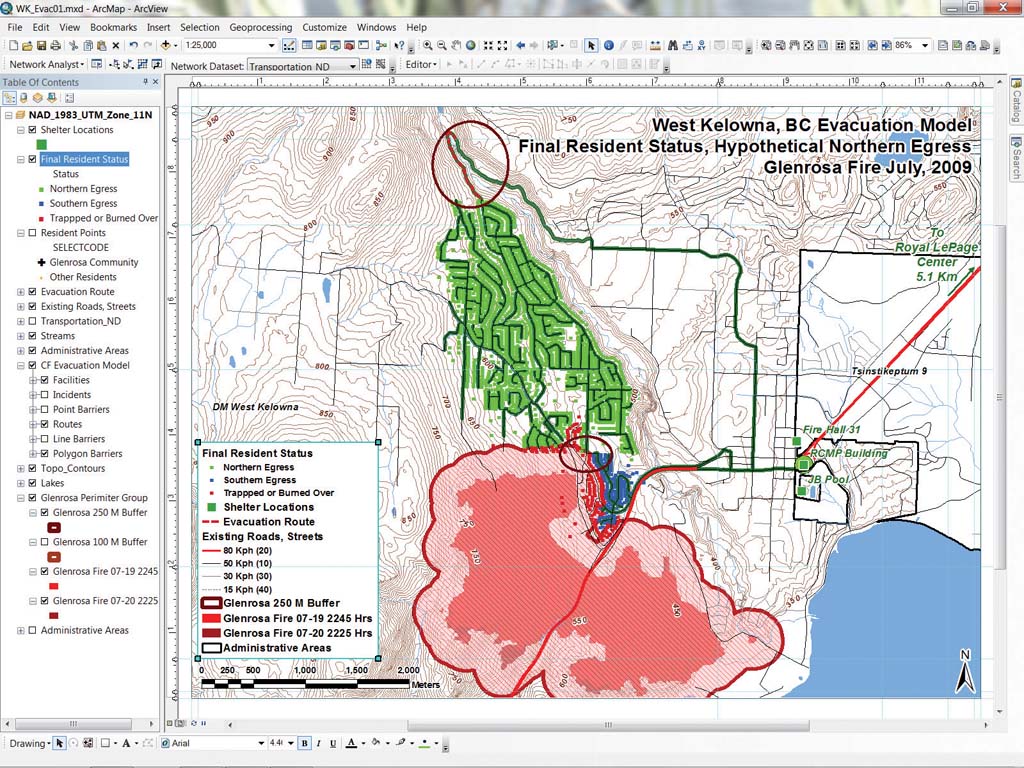
The Final Resident Status shows how relates, spatial selects, and some minor editing were used to code all Glenrosa residences to evacuation routing, taking into account the full 250 m fire buffer and the proposed northern egress. Residences subject to entrapment and direct fire exposure are noted.
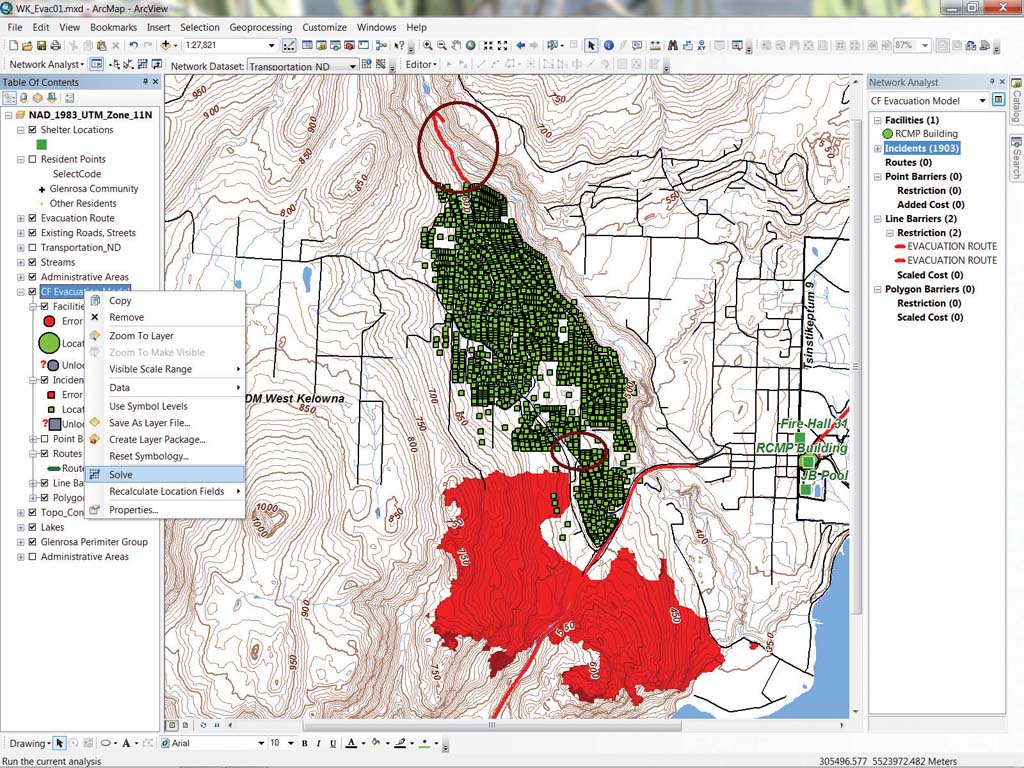
The next step will be to load the Glenrosa fire perimeter. ArcGIS 10 doesn't require placing and managing many barrier points to emulate complex geometries. Instead, restricting network travel is accomplished more simply by loading polyline and polygon barriers.
- In the Network Analyst Window, right-click Polygon Barriers and select Load Locations. Load from Glenrosa Fire 07-20-2225 Hours. Set the Sort field to OBJECTID and set Name to FIRENUMBER. Click OK and save the project.
- Because the TOC is set to List By Selection, solve the model again by clicking the Solve icon on the Network Analyst toolbar. (This solves using the current solver in the Network Analyst window, so be careful if the TOC contains multiple solvers.)
- When the solver is finished, the Glenrosa fire perimeter should have closed Glenrosa Road, and 1,897 residences will now have to evacuate by sneaking around on Lower Glenrosa Road.
Expanding the Fire by Loading Buffers
What happens if the fire crosses Glenrosa Road and extends into the Webber/Lower Glenrosa area? How will the thick smoke and close proximity to the flames along Glenrosa Road affect evacuation efforts?
- Load the 100 m and 250 m buffers to test this possibility. In the TOC, momentarily return to List By Drawing Order, open the Glenrosa Perimeter Group, and make Glenrosa 100 M Buffer and Glenrosa 250 M Buffer visible.
- Change the TOC back to List By Selection. Right-click Polygon Barriers in the Network Analyst window and choose Load Locations. Load the Glenrosa 100 M Buffer and specify OBJECTID for the Sort field and Label for the Name field. Resolve the network and inspect the Lower Glenrosa evacuation route. How many evacuees use this route now? How many use Glenrosa Road? Save the project.
Challenge Question: How many residences are burned over, and where are they located? How many residences are not accounted for in this iteration of the model? The answer is given at the end of the article. - To expand the fire footprint, load the Glenrosa 250 M Buffer in Locations and specify OBJECTID for the Sort field and Label for the Name field. Resolve the model and inspect the results. Select and count the evacuees arriving at the RCMP Building. Now 111 residences can evacuate, but 1,792 residences have been burned over. This must be fixed.

What happens if the fire crosses Glenrosa Road and extends into the Webber/Lower Glenrosa area? How will the thick smoke and close proximity to the flames along Glenrosa Road affect evacuation efforts?
Opening the Back Door
In the area where urban development meets forest land (the wildland-urban interface), it is important for communities to have alternate means of egress in the event that primary routes are blocked. Using topography, imagery, and existing roads and trails, the author designed a hypothetical northern egress route that exits the Glenrosa community in the far north. However, to use this route requires opening the gates and instructing many evacuees to travel north instead of south. This proposed route is narrow and slow, but it is far from the fire threat.
In the Network Analyst window, right-click Line Barriers and select Delete All. Save the project and solve it again. Now, 1,643 residents have egress along the northern portal, and 111 residents will still be evacuated in the south. Unfortunately, 149 residences will be burned over. By preparing a series of relates and attribute queries, where residents live and work can be quickly determined so they can be quickly moved out of harm's way.
Finishing Up
- To finish this exercise, switch back to List By Drawing Order in the TOC and zoom to the WK 1:25,000 bookmark.
- Navigate to \WK_Evacuation\SHPFiles\UTM83Z11 and load the Final Resident Status Layer file.
- Add this layer to the map's legend. Open its table, move to the far right, and inspect the Status field. Using a series of relates, spatial selects, and minor editing, the author coded all Glenrosa residences with their assigned evacuation routing using the full 250 m fire buffer and the proposed northern egress. Residences subject to entrapment and areas subject to direct fire exposure are identified. This map shows one way this data could be presented to the community.
Challenge Answer: Lower Glenrosa: 1,886; Glenrosa: 3; Unaccounted for: 14
Acknowledgments
The author thanks the staff of the District of West Kelowna—especially GIS analyst Kevin Wang—for the opportunity to re-create the Glenrosa Fire incident with actual district data and experiment with alternatives to extend and test the evacuation model. Thanks also go to the Vancouver and Kelowna offices of ESRI Canada Limited for their encouragement in choosing this incident to model.
Thanks go as well to the Esri Network Analyst development team members for their patience, recommendations, and support (both moral and technical) in the author's continued testing of this very effective and innovative product. Thanks for the polyline and polygon barriers—they are great!