ArcUser Online
Tracking a Dynamic Environment
System integrates information access for Port of Los Angeles
By Matthew DeMeritt, Esri Writer
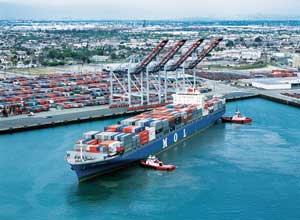
Nearly 190 million metric tons of cargo come through the Port of Los Angeles annually. (Photo courtesy of Port of Los Angeles.)
This article as a PDF.
The Port of Los Angeles' enterprise GIS system provides operational awareness and integrates both static and dynamic data at one of the world's busiest ports.
In terms of shipping container volume and cargo value, the Port of Los Angeles is the leading seaport in North America according to the American Association of Port Authorities (AAPA). It encompasses 7,500 acres with 43 miles of waterfront and 27 cargo terminals.
Ports have larger and more complicated infrastructures than most gateways of commerce. The physical structure can change over time as roads and railroads move, new docks are built, and infilling with rocks and gravel creates additional shoreline.
In 2009, the port hired Esri and GIS consultant NorthSouth GIS LLC to create a system that would aggregate, serve, and share port data throughout all its divisions.
The Main Driver: Unified Operations
The port's 27 cargo terminals include dry and liquid bulk, container, breakbulk, automobile, and omni facilities. The volume of goods going through the port, combined with national security concerns, prompted a focus on giving operations, including the Port Police, access to every kilobyte of data related to the port.
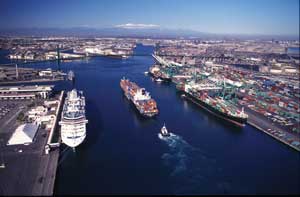
The main channel of the Port of Los Angeles, the leading seaport in North America in terms of shipping container volume and cargo value (Photo courtesy of Port of Los Angeles.)
"The initiative to improve data sharing began with the police," said Christine Thome, enterprise GIS manager at the Port of L.A. "Port Police needed complete situation awareness, and that couldn't be had without a framework to access other divisions' data." Most of the data was locked up in GIS silos within the department, with no system in place to efficiently serve and share the information throughout the enterprise. The IT division knew that a simple data portal would allow police to mine whatever data they needed at any time.
"Optimizing the way our Port Police division dispatched officers to certain locations was a top goal," said Thome. "We know that a system of servers would provide a foundation for a robust Blue Force Tracking system that shows where all officers, vehicles, and vessels are at any given time." The success of the project convinced management—and the rest of the divisions that actively shared their data with Port Police—that an enterprise GIS implementation would work for all port operations.
Operational Awareness and Permissions
Because Port Police handle sensitive data that only security personnel can manage and view, data permissions for each department was an issue that needed to be addressed first. Every division that owns and maintains data for the Port of Los Angeles has permissions for updating and making changes to its datasets, but the security rights given to each layer depend on who has permissions to view and update that data.
"We formed a technical advisory committee to determine each division's permissions to govern its own data," said Daniel Elroi, president of NorthSouth GIS, LLC. "The division that 'owns' that data is the only division that can change it, though most port employees can view almost all the layers."
The Enterprise Viewer: geoPOLA
In addition to a tremendous amount of static GIS data, the Port of Los Angeles also needed to integrate and display its dynamic data on an enterprise viewer. Information about ship schedules, weather, and movable assets is constantly updated and just as crucial to operations. Without access to that information, complete maritime domain awareness (nautical speak for "common operating picture") wasn't possible.
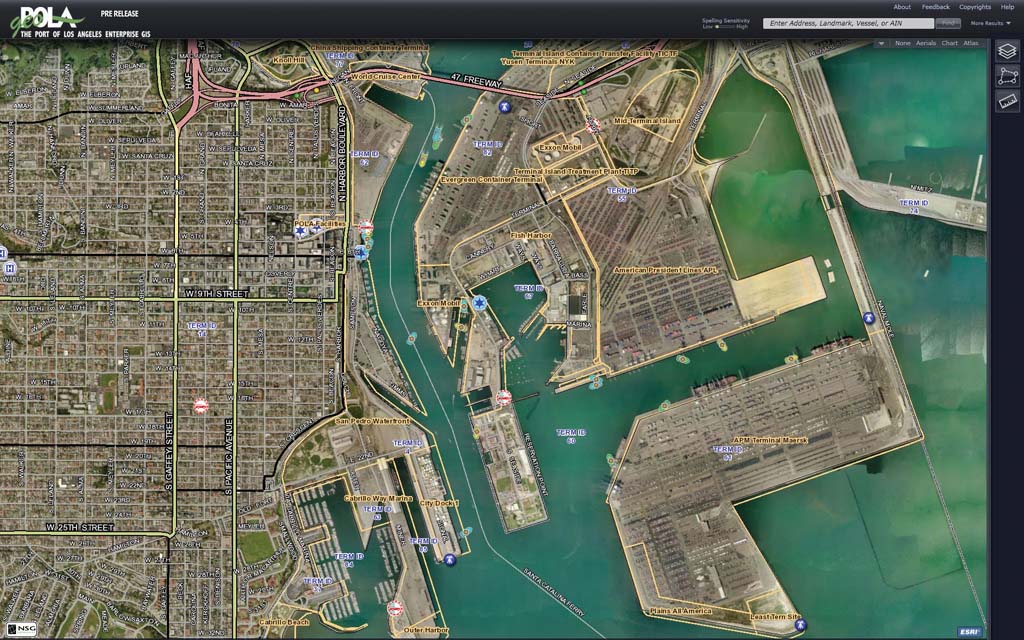
Port staff view data exclusively through geoPOLA, a viewer created with the ArcGIS API for Microsoft Silverlight.
"A viewer was created with the Silverlight API that would display all enterprise data, including the dynamic data," said Elroi. "Port data changes frequently in location, status, or both. The key to delivering optimal awareness across the board was to write software that combined static and dynamic awareness in one area for everyone to view."
Port of Los Angeles staff view data exclusively through the browser-based Silverlight viewer called geoPOLA. The port's GIS editors, who use AutoCAD and ArcGIS, have praised the viewer for its outstanding performance. In particular, they enjoy its ability to consume many different map services that can be used when working with GIS data.
Feeds and Metadata
One of the most important aspects of a modern GIS implementation is the integration of data from disparate sources. "We needed to carefully research which feeds we would connect to the enterprise viewer," said Thome. "We knew there were good feeds out there but also ones that wouldn't deliver the kind of information we needed."
That process involved the creation of a Dynamic Data Focus Group that met and determined what type of dynamic data was needed. This group and NorthSouth GIS researched different sources of data to see if they had anything that the port could consume as a feed.
After three months of research, they finally chose the feeds that delivered the information the port could use on vessels, radar, automatic vehicle location (AVL), weather, traffic, and California Highway Patrol alerts. The system is also designed so that new dynamic feeds can easily be added through the GeoRSS broker.
Almost as important as dynamic data integration is the creation of metadata standards and procedures. For that, a metadata program was customized that simplified the creation, tracking, and management of the port's finer-grained data. "That program was invaluable in helping us set up our standards and procedures for capturing metadata," said Thome. "Without it, creating these standards manually would have taken forever."
The Port of Los Angeles needed to integrate its internal operations to remain efficient and profitable. Today, more than 1,200 computer users at the port can access and update GIS data that provides a complete maritime domain awareness for the port. In 2010, the Port of Los Angeles received an award for excellence in technology from the AAPA for its enterprise GIS.
About the Author
Matthew DeMeritt is a writer in Esri's Marketing Communications Department. He focuses on GIS technology and the mining industry.