ArcUser
Winter 2012 Edition
Exploring Threats to Coral Reefs
With online presentation and GIS datasets
By Witold Fraczek, Esri, and Katie Reytar, WRI
This article as a PDF.
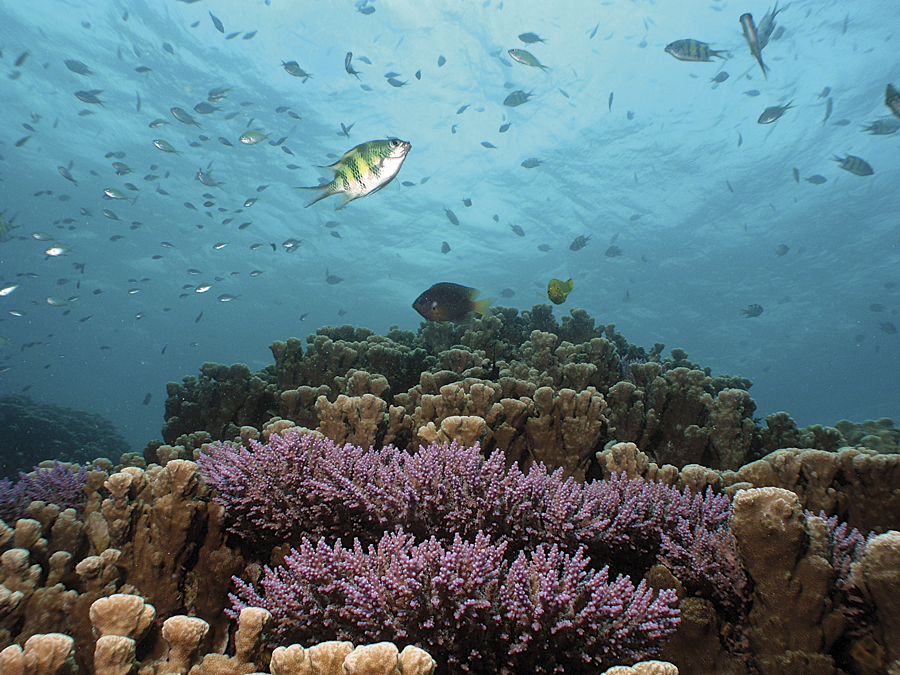
Photo courtesy of David Burdick
You can explore datasets from the World Resources Institute (WRI) Reefs at Risk Revisited project using ArcGIS Explorer Online, Esri's free web viewer.
Assessing Threats, Raising Awareness
WRI has been using GIS to develop highly detailed maps of the threats to coral reefs worldwide since 1998. Coral reefs are vital to maintaining the diversity and viability of marine ecosystems. They provide livelihoods and food for coastal communities and shelter and protection for shorelines.
The goal of the Reefs at Risk project is to produce globally consistent data, maps, and reports that are hybrids of model results and observational evidence that can be used to raise awareness about the location and severity of specific threats to coral reefs. GIS is used to develop spatial indicators linking human activities and livelihoods to pressures on coral reef ecosystems.

The top map (A) shows reefs classified by present integrated threats from local activities. In the middle (B) and bottom (C) maps, reefs are classified by integrated local threats and projections of thermal stress and ocean acidification for 2030 and 2050, respectively.
The project has spawned four publications between 1998 and 2011—a global analysis; two detailed regional analyses; and, most recently, a high-resolution update of the first global analysis.
Reefs at Risk Revisited improves on the 1998 global analysis in several important ways. It uses a global map of coral reefs at 500-meter resolution and benefits from improvements in the many global datasets used to evaluate threats to reefs. Most threat data is at 1-square-kilometer resolution. For the first time, it also includes an assessment of climate-related threats to reefs as well as an assessment of the vulnerability of nations and territories to coral reef degradation, based on their dependence on coral reefs and their capacity to adapt. Finally, it takes advantage of the many advances in online web mapping applications, such as ArcGIS Explorer Online, to reach a broader audience that is web savvy, but not necessarily GIS savvy.
Exploring Reefs at Risk Revisited Data
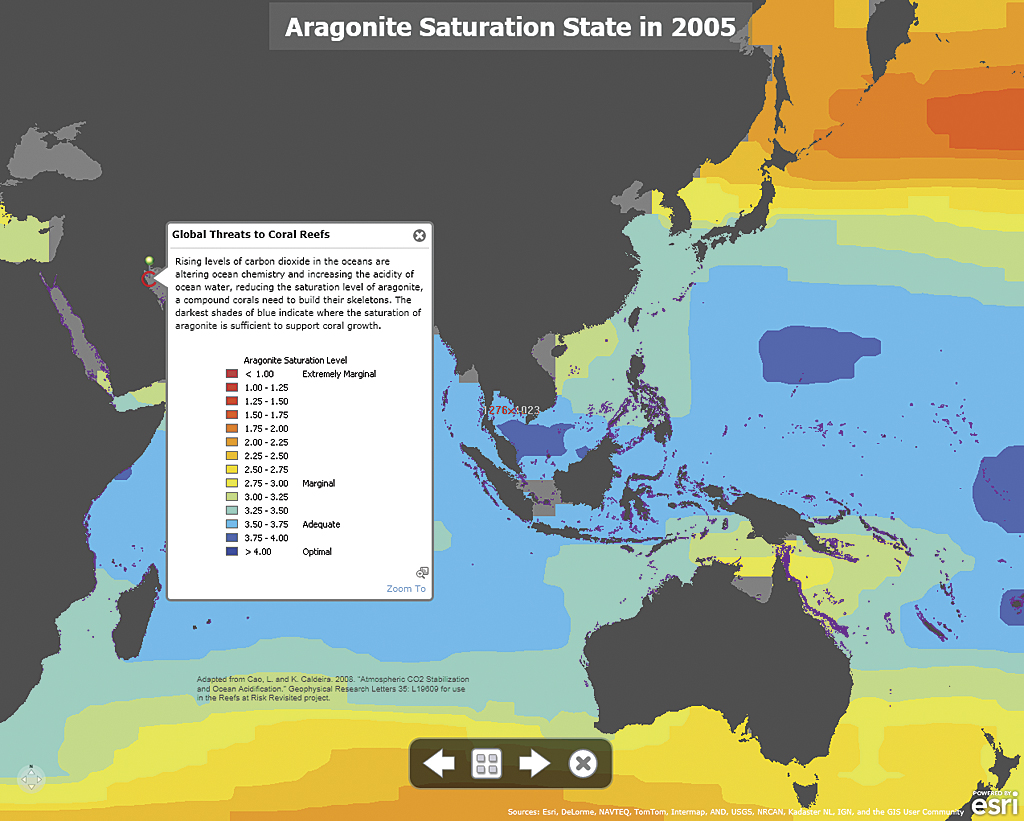
A presentation, Reefs at Risk Revisited: Mapping Threats to Coral Reefs, was created in ArcGIS Explorer Online displaying threats to the world's coral reefs using GIS data from the WRI project. The presentation, publicly available at the arcgis.com website, includes a set of 15 global thematic maps showing various threats to coral reefs such as overfishing, destructive fishing, and projected changes in ocean chemistry due to climate change. Although the dataset is global in extent, to facilitate the presentation of the level of detail available, some slides are zoomed in to localized areas. In each map, users can navigate to regions of interest.
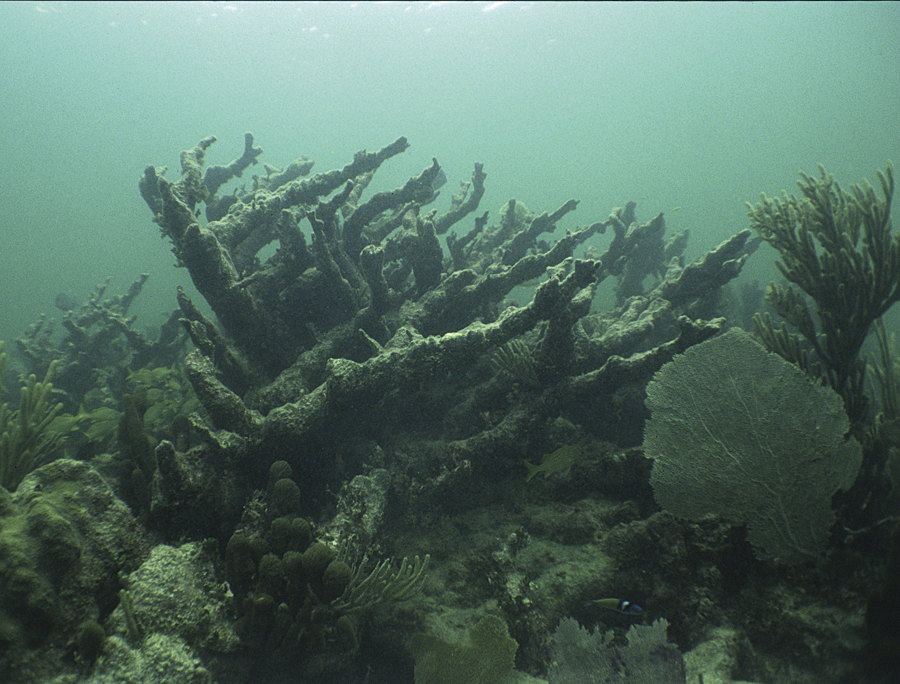
Photo courtesy of Mark Spalding
To view this application in ArcGIS Explorer Online, go to explorer.arcgis.com. In the Find Maps and Groups search box, type reefs. In the search results, find Reefs at Risk Revisited: Mapping Threats to Coral Reefs. Click the Details option to view information about the presentation.
The GIS data used in this map resides on an Esri server rather than locally. The map can be explored in two modes: mapping and presentation. In mapping mode, the user can change the visual appearance of the maps, change symbology, and edit legends and text. In presentation mode, maps are viewed as slides.
The map titles, pop-up legends, and data source information have been prepared individually for each map in the presentation. When the presentation opens on the first slide, click the red pin to read instructions on navigating the slide show. Two options are available for viewing the slides. The first option allows a user to select a slide from the panel of thumbnails at the bottom of the interface to view them in a limited size display window. If a lock icon appears in the upper right corner of the map window, click it, and the map will be freed for navigation.
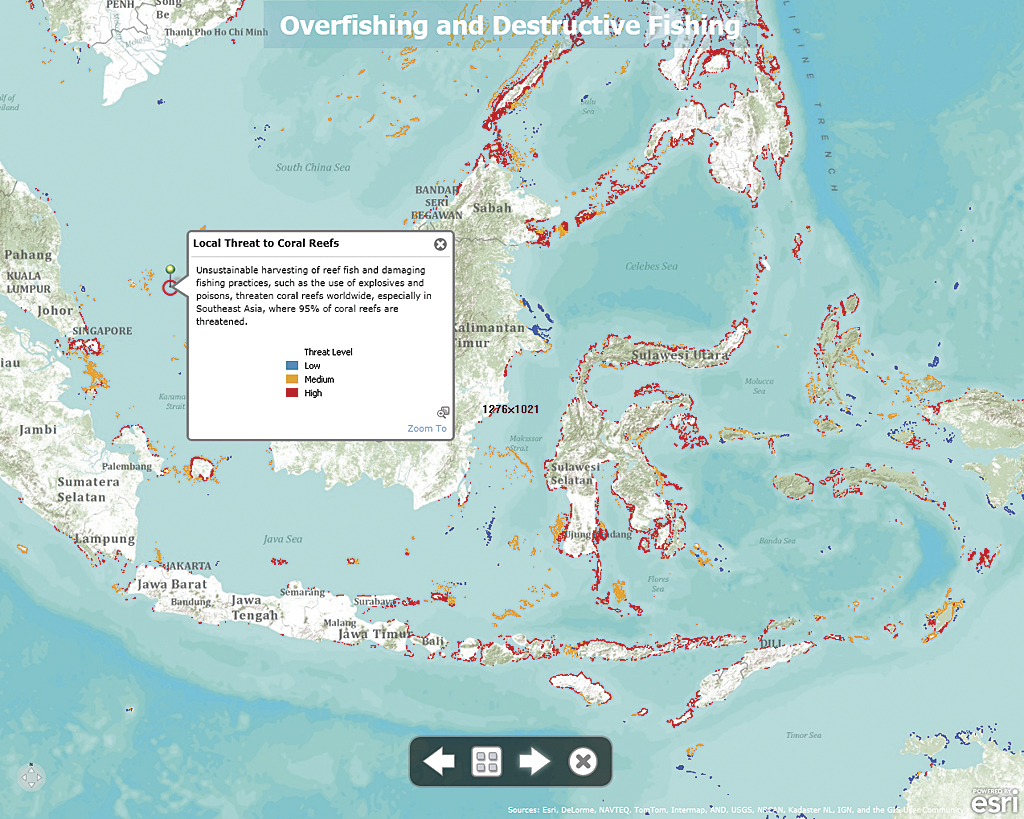
The data in the ArcGIS Explorer Online presentation demonstrates that coral reefs in Southeast Asia are the most threatened in the world.
The second option allows the user to view the slides in full-screen mode, which can be accessed by clicking the Start Presentation icon in the toolbar at the top of the window. In full-screen presentation mode, users can pan and zoom with a mouse or with the Navigation tool located in the lower left corner of the display window. The XY icon at the bottom of the Navigation tool offers an option to display a scale bar and the geographic coordinates of the current cursor position.
Priceless Data Freely Available
In addition to exploring these datasets using the ArcGIS Explorer Online presentation, a comprehensive collection of the raw input data used in the modeling and model results are freely available.
Learn more about the variety of threats to coral reefs by viewing the presentation. About 95 percent of coral reefs are at risk from local threats, primarily overfishing/destructive fishing, coastal development, and land-based pollution.
- Marine conservation practitioners, resource managers, policy makers, and development agencies can use these datasets and maps to identify opportunities to protect reefs, set priorities, and plan interventions.
- Businesses that rely on or affect coral reef ecosystems can use this information to mitigate risks and protect their long-term economic interests.
- Educators can use the datasets, reports, and online resources to build GIS and geography skills in their students as well as teach about threats to coral reefs, thereby planting the seeds for a new generation of marine conservationists.
- The media can use this data for immediate news and as the basis for future research and communication.
Data can be downloaded from the WRI Reefs at Risk website and is also available as a compiled DVD by request (e-mail: reefsatrisk@wri.org). In the first six months after its release, the website logged more than 900 downloads of Reefs at Risk Revisited datasets. A copy of the Reefs at Risk Revisited report can also be obtained at www.wri.org/reefs.
 About the Authors
Witold Fraczek has a master's degree in hydrology from the University of Warsaw, Poland (1976), and another master's degree in environmental monitoring/remote sensing from the University of Wisconsin, Madison (1988). In 2006, he defended his PhD dissertation at the Forestry Department of the Agricultural University of Warsaw. He joined Esri in Redlands in late 1988 and, for the last several years, has worked at the Application Prototype Lab. His areas of interest include raster analysis, hydrology, geostatistics, cartography, and 3D visualization.
 Katie Reytar is a research associate at WRI in Washington, D.C., where she specializes in applied GIS to manage and conserve coastal marine resources, and has worked on the Reefs at Risk Revisited project since 2008. She has a BS in civil and environmental engineering from Johns Hopkins University and a master of environmental science and management degree from the University of California, Santa Barbara.