ArcUser
Winter 2012 Edition
New, Insightful Ways to Describe the World
Rule-based 3D mapping with Esri CityEngine
By Nathan Shephard, 3D Visualization Product Engineer Lead
This article as a PDF.
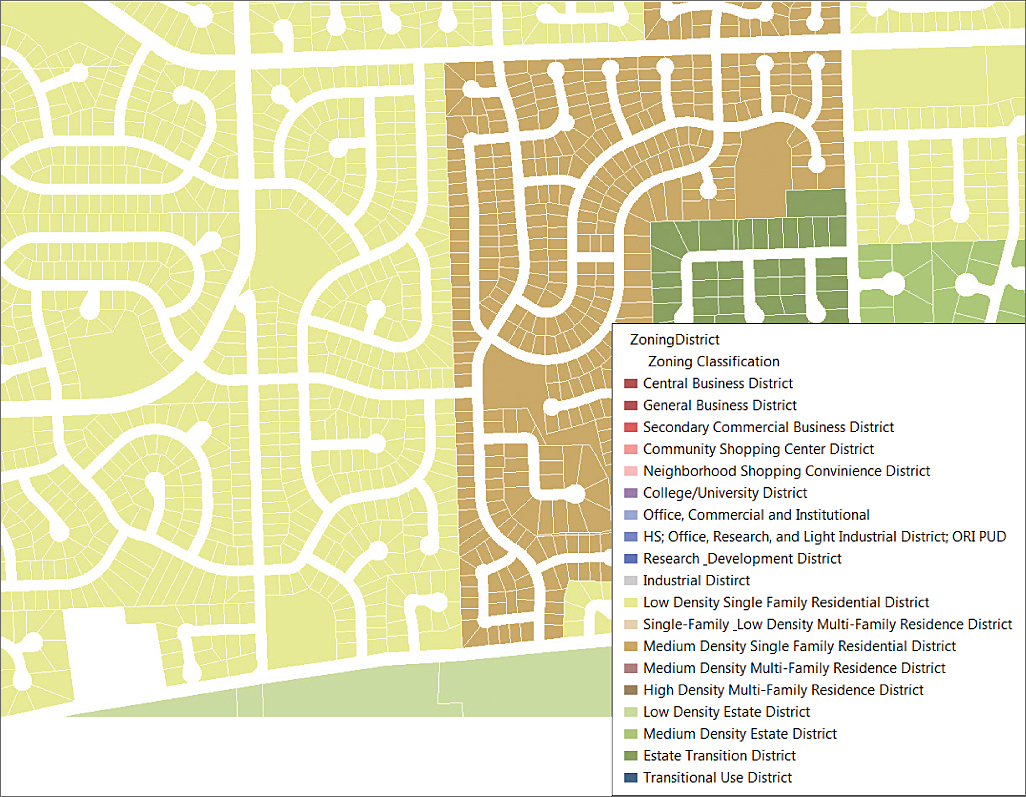
Figure 1: A 2D zoning map often requires a legend to be understood.
Many GIS problems, particularly in the area of urban development, can only be solved in 3D. Esri CityEngine 2011 generates 3D urban environments for city planners, architects, military users, and those in film and entertainment. Most of the time, these users will be trying to replicate an as-built world and will try to closely match real-world objects in terms of physical location and size of 3D objects, such as buildings and trees.
However, there is another side to procedurally generated content to be explored—the construction of a cartographic view of the world. In this world, it is much less important to capture the physical size and shape of 3D objects. Instead the goal is to display geographic features in a way that makes them more understandable to the viewer.
For example, in the real world, a tree needs a trunk and limbs and height that reflects the species type. However, in the cartographic world, a tree can be represented simply as a colored ball on a stick—and be more understandable. Let's explore this idea in the context of something that seems simple: the display of a city's zoning rules on land parcels.
2D versus 3D Cartographic Techniques
In 2D, a standard cartographic map uses hue, saturation, and value to distinguish the different zoning classifications (e.g., Single Family Residential, Medium Density Residential, Low Density Estates/Parks). While this simple technique is effective in differentiating between the zoning types, it also relies on the user being familiar with the meaning of the hues or having direct access to a legend. Furthermore, there is a limited number of hues that can be used before the meaning becomes ambiguous.

Figure 2: Zoning classes shown by a 3D map are more intuitive and reduce the need for a legend.
However, move that same data into a 3D map and there are opportunities to represent the data in a way that is more natural and recognizable for the viewer. For example, single family homes are usually set back from the edge of the parcel and—as any five-year-old with a crayon would attest—they should be drawn as rectangles with triangular, pitched roofs. On the other hand, medium-density residential areas typically consist of dwellings like townhouses that usually abut the parcel line and have multiple stories. Parks are commonly represented as areas with green grass and scattered trees.
The good news is that all three of these ways of representing zoning classification can be easily defined with procedural rules inside Esri CityEngine.
Compare the representation of the zoning rules in Figure 2 to that of the more traditional 2D map in Figure 1. The same hues are used in both views, but the cartographic display of the objects in 3D is instantly understandable without the need to refer to a legend because the symbols are familiar and recognizable. The 3D map in Figure 2 was created in CityEngine using a single procedural rule applied to all the GIS features inside CityEngine. That rule honored the feature attributes and constructed different 3D symbols.
The Anatomy of a Procedural Rule
A procedural rule in CityEngine, stored as a .cga file, works very much like a hierarchical scripting language. Figure 3 explains how the zoning classification rule was written.
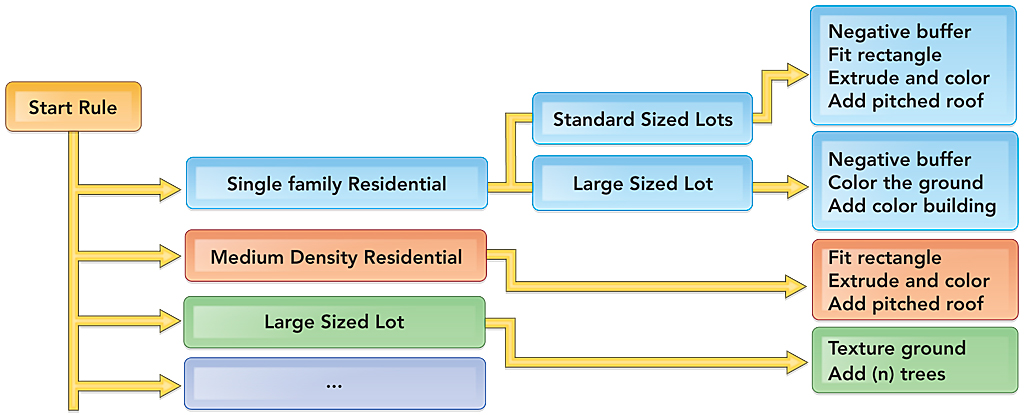
Figure 3: The design of the Zoning Classification rule file
All rule files require one or more start rules, which are initial entry points that are applied to the incoming raw geometry of the features that were, in this case, the parcel polygons. The single shared start rule uses the ZONECLASS feature attribute to distinguish the three kinds of objects to construct: Single Family Residential, Medium Density Residential, and Parks objects.
Single Family Residential polygons are further separated out into standard- and large-sized lots. This is done because standard-sized lots can be used directly to define a representative house shape, but larger lots look peculiar if they have a single, enormous house on them.
For standard-sized lots, the polygons are reduced in size via a negative buffer (to simulate open space [i.e., the side setback] between houses) and a best-fit rectangle shape is placed within the area that represents a simple house shape. This box is then extruded upward with a pitched roof to represent a single-story home.
For large-sized lots, the polygons are also reduced in size via a negative, but instead of extruding the shape upward into a house, the ground is colored. In the last step, a single representative building model is placed in the center of the lot.
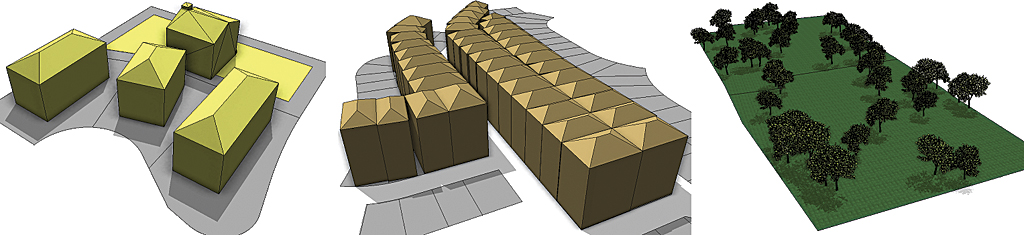
Figure 4: Land parcels with Single Family Residential, Medium Density Residential, and Parks zoning classifications displayed in Esri CityEngine using simple 3D cartographic techniques
All Medium Density Residential polygons, regardless of size, are calculated with a single technique, because the variety in the size of these features is minimal. The rule simply creates the best-fit rectangle within the parcel and extrudes it up three stories with a pitched roof. This gives a townhouse appearance to the constructed geometries with parcels that have a common orientation, share boundaries, and stack up against each other.
The Park polygons are also handled using a single technique. First, the entire area is displayed with a grass texture and then tree models are distributed randomly over that area. The number of trees added is calculated as a function of the parcel's size so all parks have a similar appearance. You can probably already imagine how easily this rule could be used to create forests (using a denser algorithm to produce more trees) or open spaces with a sparser algorithm for fewer trees.
While the current rule only handles the three zoning classifications described, it can easily be expanded for other zoning types such as office space, commercial areas, and industrial zones.
| Element | Description |
|---|---|
| case | Process objects differently based on an attribute or property |
| color | Set the object's base color |
| texture | Add a texture image onto an object |
| scatter | Spread models over an area |
| offset | Similar to a buffer operation |
| innerRect | Find a rectangle within an area |
| extrude | Expand the object upward to create a volumetric shape |
| roofHip | Create a ridged roof |
Conclusions
Viewing GIS data in 3D provides many opportunities to create new and insightful ways to describe the world we live in. The Esri CityEngine rule-based definition of symbology allows the inventive use of 3D shapes, models, colors, and texture for describing our complex world in a more natural and familiar way.
About the Author
Nathan Shephard is the 3D visualization product engineer lead at Esri in Redlands, California, where he works on the 3D Analyst extension product. He is also an honorary (though remote) member of the Esri Zurich R&D Center, which creates the Esri CityEngine product.