The Practical Union of OLAP Analysis and Geographic Mapping
By Gail Kramer and Stuart Nisbet, SAS
Whether it is product sales, insurance rates, or credit card fraud, multidimensional data often contains a geographic dimension that allows analysis based on various locations. In many cases, these locations are political ones such as country, state, province, or city boundaries. In other cases, locations, or regions, are defined based on business rules such as sales territories, wireless coverage plans, or population-based Designated Market Areas (DMAs). In all cases, these defined regions provide a critical context for online analytical processing (OLAP) exploration and reporting. Coupling the power and flexibility of ArcGIS 9 Server with modern OLAP reporting tools, the A in OLAP has never looked so good!
This article introduces some of the well-documented benefits of OLAP exploitation and suggests how these benefits can be extended to include geographic display and navigation. It describes an overview of the methodology and implementation details for linking levels of an OLAP hierarchy with layers in a geographic map and discusses the applicability of this functionality to a few vertical business domains.
What Is OLAP?
No OLAP document would be complete without first defining what is meant by OLAP. In a formal sense, OLAP is defined as fast access to large amounts of summarized data. Implied in this definition is the concept of dimensionality. Without dimensions, there would be nothing to summarize the data by. Thus, a more generalized definition might be the ability for users to quickly interrogate large amounts of data, at varying levels of detail, across a variety of combinations of business dimensions.
OLAP is full of terms and acronyms that are often ill defined. Before digging too deeply into OLAP, it is helpful to provide a few basic definitions of some of the OLAP terms that will be used in this article. Table 1 lists these definitions.
| Term | Definition |
| Dimension | A business perspective that is useful for analyzing data by or across that is often referred to as a hierarchy. Examples: Time, Product, or Geography. |
| Hierarchy | A dimension may contain one or more hierarchies. Each hierarchy specifies an order for some or all of the levels in a dimension that is used to determine the navigation path. Example: Country, Region, State or Region, City. |
| Level | Dimensions are often made of various levels of detail. For example, the Time dimension may consist of Year, Quarter, and Month levels. For dimensions with only one level, the level is implied. When referring to the physical representation of data, a dimension level is sometimes referred to as simply a dimension (or for those familiar with SAS terminology, a class variable). |
| Member | A given value of a dimension level. For example, members of the Year level of the Time dimension could be 1998, 1999, and 2000. The number of unique members at any dimension level is referred to as the cardinality of that dimension level. |
| Measure | The ultimate business measure that is being aggregated such as sales or profits. Measures also have statistics associated with them such as sum, count, and average. Those familiar with SAS terminology may refer to these as analysis variables. |
Table 1: Common OLAP terms
OLAP Storage Technology
OLAP delivers fast, consistent, interactive access to a wide variety of possible views of information. OLAP Storage Technology drives this delivery by summarizing detailed data and storing summaries for fast access. Enterprises collect all sorts of business events using front-end business applications such as enterprise resource planning (ERP) or customer relationship management (CRM) systems. These bits and pieces of information are stored in small transactions optimized for fast processing. To generate an overview on what is going on in business, all these transactions need to be summed in a process that consumes lots of computing power and time and requires knowledge of how to access and summarize these transactions. OLAP Storage Technology overcomes these issues by hiding the complexity of detailed data stores and by precalculating views on business that are likely to be requested by business users.
OLAP Viewing Components
Even though most of the real OLAP work is done in OLAP Storage, OLAP viewing components reveal information to end users and are therefore most often associated with the term OLAP. There are different flavors of viewing components available from SAS that can be grouped into Web-based and desktop-based components that provide static or dynamic views of the multidimensional information. Static Web-based reports, suitable to line-of-business users, keep these users informed about business operations. Interactive desktop-based reports support decision makers by providing them with a 360-degree view of their business and the capability to further analyze trends or exceptions in the information.
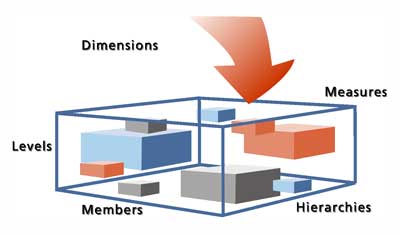 |
| Relationships between common OLAP components. |
Geographic Integration with OLAP Is Powerful
Natural hierarchies are present in the business questions that are asked daily. Which products sold well? When were they sold? Who is selling the most? Where are the profitable stores? What demographic factors affect sales? These questions can be answered using OLAP tools and traditional reporting with hierarchical levels such as the ones shown in Table 2.
| Question | Sample Hierarchy | Example |
| Which products sold well? | Product Category/Product Type/Item | Office > Furniture > Desk
Office > Supplies > Pencils
Home > Garden > Lawn Mower |
| When were they sold? | Year/Quarter/Month/Day | 2004 > First > January > 25 |
| Who is selling the most? | National Sales Director/Regional Sales Manager/Local Sales Representative | Betty Brown > Bob Smith > Sam Jones |
| Where are the profitable stores? | Region/State/ZIP Code | Southeast > NC > 27513 |
| What demographic factors affect sales? | Age/Income/Education | Under 29 > 55K-100K > 4-year degree |
Table 2: Hierarchies
Many such questions can be answered with OLAP reporting, but they frequently fall into the categories of who, what, where, when, and why. Tabular reporting does a fine job of providing the facts in summarized form, but to answer "where" questions in the most intuitive fashion requires maps. Just imagine weather reports that use only a tabular listing of states and counties with their respective highs, lows, and expected rainfall. An alphabetized list, or even one sorted by measure (such as temperature), loses a good deal of context if proximity to physically surrounding information is not available. OLAP reporting tools have often used graphic representations, such as bar and pie charts, to represent quantitative information more visually. They have not, however, leveraged mapping technologies to the same degree to help present location-based information in a familiar form.
Continued on page 2
|