ArcUser Online
Solar radiation is the primary energy source that drives many of the earth's physical and biological processes. Understanding its importance to the landscape at a variety of scales is key to understanding a broad range of natural processes and human activities. For example, in Yellowstone during the winter months, populations of ungulates (e.g., bighorn sheep, elk, and mule deer) are more concentrated in locations that receive relatively high levels of solar radiation. Over a large area, it may not be very difficult to model the received solar radiation when the topography and cloud cover are not considered. However, modeling the solar radiation received at locations in mountainous areas with complex topography at 30-meter resolution is not a simple task. The amount of radiation may vary spatially and temporally in complex ways that are difficult to measure. Because solar radiation data is not readily available, researchers usually base geostatistic and geointerpolation models on limited point data from weather stations to interpolate solar radiation and temperature. However, because these stations are sparsely distributed and located in open, flat, and populated areas, they are not spatially representative of the area. Looking at Solar Radiation ModelingAt landscape scales, topography is the major factor that determines the spatial variability of incoming solar radiation (insolation). Variation in elevation, orientation (i.e., slope and aspect), and the shadows cast by topographic features all affect the amount of solar radiation received at different locations. Measuring variability is also confounded by a site's latitude, the local cloud cover present when measurements are taken, and sun angle shift (changes attributable to differences in time of day and time of year). These factors contribute to the variability of microclimates and include factors such as the spatial distribution patterns of air and soil temperature, evapotranspiration, snow melt patterns, soil moisture, and the amount of light available for photosynthesis. A team composed of researchers from NASA, YERC, CCEO, and Esri, led by Dr. Chris Potter of NASA, has undertaken an ambitious research project that will model solar radiation and surface temperatures in Yellowstone and generate solar radiation and temperature data at 30-meter scales. This project makes use of high-resolution (30-meter vertically accurate) U.S. Geological Survey digital elevation model (DEM) data, Western Regional Climate Center (WRCC) observations, and Natural Resources Conservation Service SNOwpack TELemetry (SNOTEL) measurements.
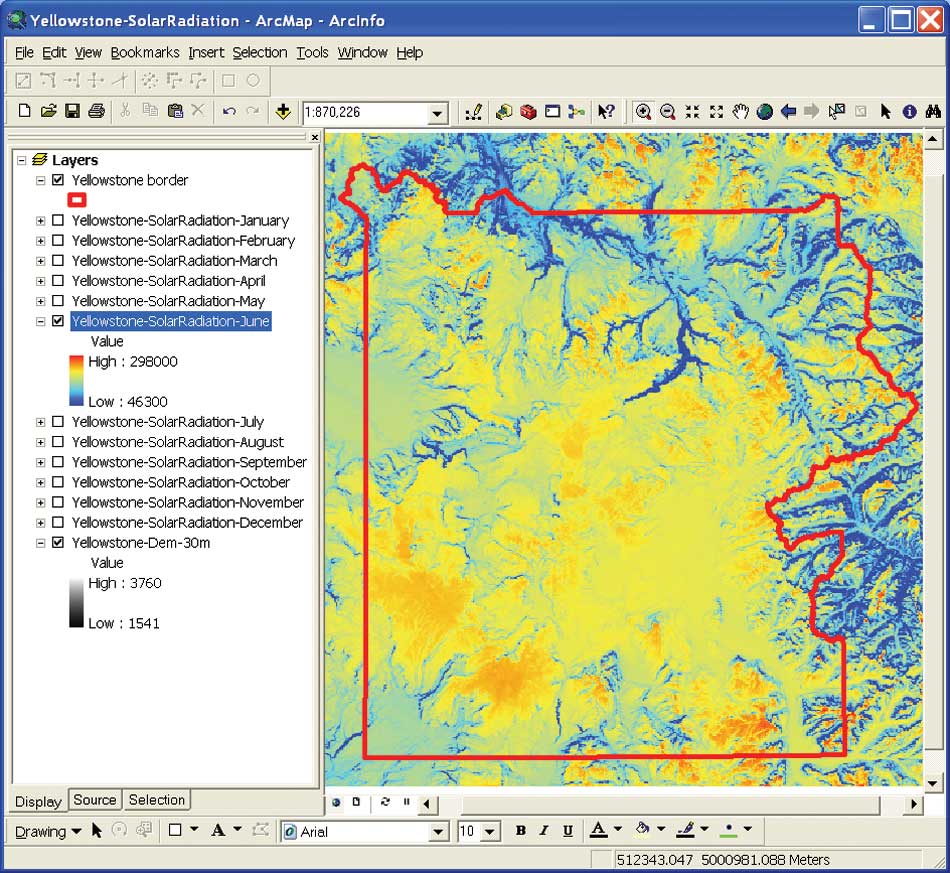
With this large collection of data layers, the challenge is to model the solar radiation for each 30-meter pixel using a methodology that considers many spatial and temporal factors related to atmospheric conditions, site latitude, elevation, slope and aspect, daily and seasonal shifts in sun angle, and the effects of shadows cast by surrounding topography. The Solar Radiation toolset, which became available with the release of ArcGIS 9.2 Spatial Analyst, enables the team to efficiently implement time-consuming processing of this data in a timely fashion. Data MethodologyThe solar radiation analysis tools available with the ArcGIS Spatial Analyst extension enable the team to map and analyze the effects of the sun over a geographic area for specific time periods. These tools account for atmospheric effects, site latitude and elevation, steepness (slope) and compass direction (aspect), sun angle shift, and topography shadows. These calculations, which can be performed for point locations or entire geographic areas, are carried out using these four steps:
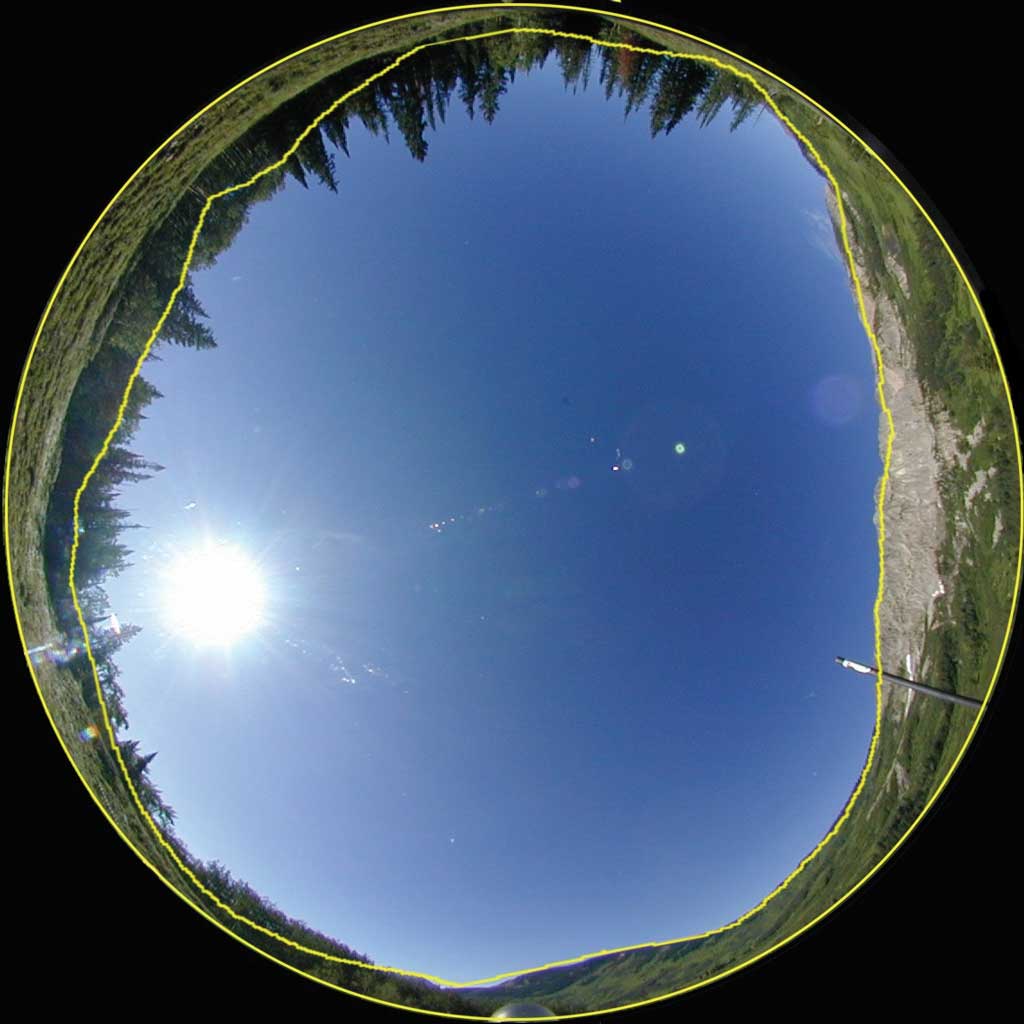
An upward-looking hemispherical viewshed for every location is calculated from the digital elevation model. A hemispherical viewshed looks like a fish-eye photograph and provides a view of the entire sky from ground level.
Direct insolation for a location is calculated using the viewshed and a sunmap of the study area. A sunmap is a raster representation that displays the sun track or apparent position of the sun as it varies through the hours of the day and through the days of the year, the same view one might see by looking up and watching the sun's position as it moves across the sky over time. It consists of discrete sectors defined by the sun's position at particular intervals during the day (hours) and time of year (days or months). The sunmap is overlaid with the viewshed raster. The topographic shadow effect is accounted for by gap fraction. Gap fraction is the proportion of unobstructed sky area in each sector. Direct radiation is then calculated for each sunmap sector using a transmission model based on gap fraction, sun position, atmospheric attenuation, and ground receiving surface orientation. The sum of the radiation of all sectors is the total direct radiation this location receives. Diffuse insolation for a location is calculated using its viewshed raster and a skymap of the study area. The skymap represents a hemispherical view of the entire sky divided into a series of sky sectors defined by zenith and azimuth angles. Each sector is assigned a unique identifier value along with the centroid zenith and azimuth angles. Diffuse radiation is then calculated for each sky sector based on direction (zenith and azimuth). The skymap is overlaid with the viewshed raster. As with the direct insolation, the topographic shadow effect is accounted for by gap fraction. Diffuse radiation is then calculated for each skymap sector using a uniform diffuse model or a standard overcast diffuse model. The sum of the radiation of all sectors is the total diffuse radiation this location receives.
Solar radiation for a ground location is calculated by summing the above direct and diffuse insolation originating from the unobstructed sky directions. The calculation is repeated for all locations of a selected area of a DEM to obtain an insolation map of the area. [Reflected radiation contributes only a small proportion of total solar radiation (except for locations surrounded by highly reflective surfaces). The solar radiation tools in the ArcGIS Spatial Analyst extension do not include reflected radiation in total radiation calculations.] The solar radiation tools in ArcGIS, which provide many default and optional parameter inputs, enabled the team to select the best local optimal application. In addition to standard parameters, such as the slope and aspect derived from the Esri DEM model, elevation, and latitude, the team calculated the diffuse proportion and transmissivity and incorporated this information into the solar radiation model. Twelve long-term monthly solar radiations were calculated. The team found that while monthly temperature is not highly correlated with the corresponding monthly solar radiation, it is highly correlated with a one-month-lag solar radiation. This knowledge enabled the calculation of a lag-corrected linear regression on surface temperature. Invaluable Information for Decision SupportSolar radiation and surface temperature modeling is computationally demanding and complicated to implement. The dataset at this high resolution could not be generated without the automated DEM and solar radiation tools available through the desktop GIS environment. However, the monthly solar radiation and surface temperature at a resolution of 30 meters greatly assist efforts to ecologically manage pine beetle outbreaks, predict invasive species incursions, and preserve wildlife species habitat in Yellowstone. Dr. Robert Crabtree at YERC is leading two important projects in Yellowstone. Funded by NASA, the goal of the first project is to model the potential intrusion of invasive species of Canadian thistle and cheatgrass into Yellowstone National Park. These species replace native vegetation in the park and threaten wildlife that rely on native plants as a food source. Solar radiation and temperature are two important parameters for this model. The goal of the second project, funded by the National Science Foundation, is to investigate the outbreak of mountain pine beetles (Dendroctonus ponderosae Hopkins), which has killed large numbers of trees in Northern America. Temperature is one of the important covariates in determining the development of pine beetles.
The species studied in both projects develop at landscape-level scales measured in tens, rather than hundreds, of meters. According to Crabtree, the available low-resolution 4-kilometer datasets available are not sufficient. However, the newly generated 30-meter resolution solar radiation and temperature information "is a fabulous dataset for these models." While solar radiation affects many biological processes that influence the distribution of species and their habitat selection, this data seldom appears explicitly as a covariate in habitat studies. In winter, the grass is covered by deep snowpack. Because it is too hard for animals to uncover food, the ungulate species, especially bison, may migrate from park to unprotected areas where they are killed by local farmers. This migration is mostly determined by forage production and snow melting. Jennifer Sheldon, YERC vice president and lead project scientist, is studying small mammals in Yellowstone. Dr. P. J. White, director of Yellowstone National Park, is responsible for the wildlife management policy in Yellowstone. Sheldon and White are now working with NASA to model the distribution of forage production and snow melting in Yellowstone using solar radiation and temperature datasets. ConclusionThe high resolution solar radiation and temperature datasets are important and previously unavailable data inputs for modeling biological processes in Yellowstone National Park. About the AuthorsShengli Huang, a postdoctoral research scientist with NASA Ames Research Center, is an ecologist who majored in geography and ecology. He has been using GIS and remote sensing tools to conduct research in Yellowstone for four years. Pinde Fu, a project lead and senior developer with Esri Applications Development Services, studied solar radiation modeling with his advisor, Dr. Paul Rich, during his doctoral studies. He and Rich developed the Esri solar radiation calculation engine. For More InformationThe Solar radiation tools are fully explained at the Esri Web site (http://webhelp.esri.com/arcgisdesktop/9.2/index.cfm?TopicName= An_overview_of_the_Solar_Radiation_tools). For more specific algorithms and applications, see the following publications: Fu, Pinde. A Geometric Solar Radiation Model with Applications in Landscape Ecology. Ph.D. Thesis, Department of Geography, University of Kansas. Lawrence, Kansas, 2000. Fu, Pinde, and Paul M. Rich. "A Geometric Solar Radiation Model with Applications in Agriculture and Forestry," Computers and Electronics in Agriculture 37: 25�35. 2002. Rich, Paul M., Ralph Dubayah, William A. Hetrick, and Shawn C. Saving. "Using Viewshed Models to Calculate Intercepted Solar Radiation: Applications in Ecology," American Society for Photogrammetry and Remote Sensing Technical Papers, 524�529. 1994. Huang, Shengli, Paul M. Rich, Robert Crabtree, Christopher Potter, and Pinde Fu. "Modeling Near-Surface Air Temperature from Solar Radiation and Lapse Rate: Application over Complex Terrain in Yellowstone National Park, USA," Physical Geography, 29, no. 2: 158�178. 2008. |