ArcUser
Spring 2012 Edition
Improving Landscape-Level Environmental Impact Evaluations
By Leroy J. Walston, Kirk E. LaGory, William Vinikour, Robert Van Lonkhuyzen, and Brian Cantwell of the Argonne National Laboratory
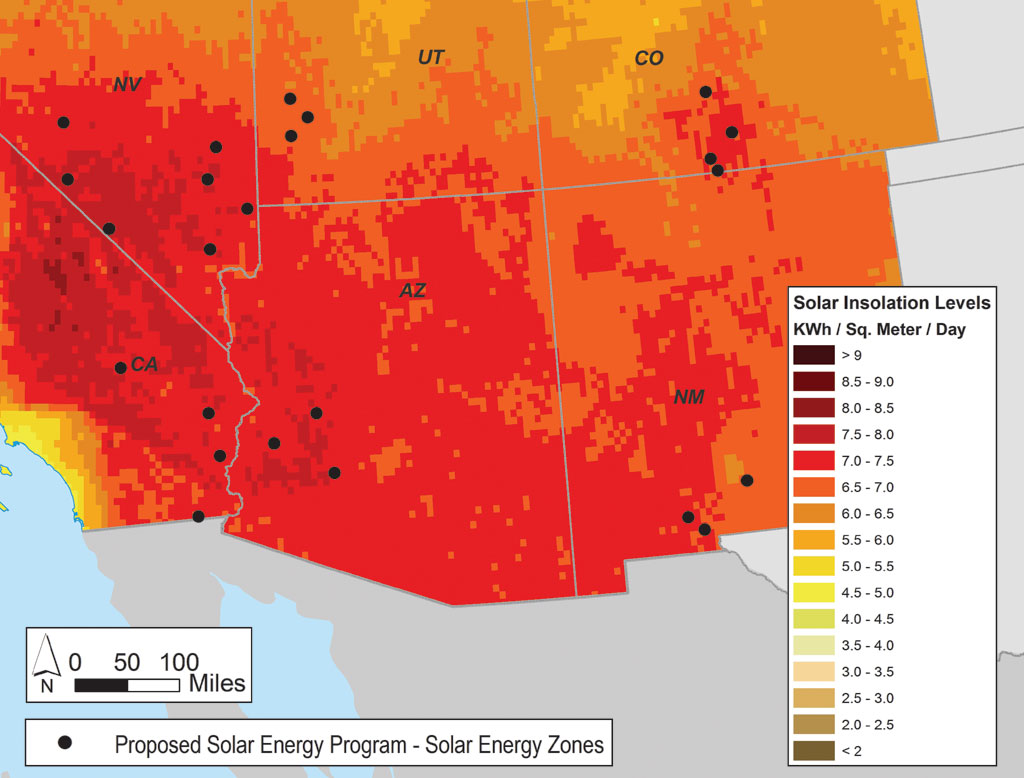
Solar Direct Normal Insolation Levels in the Southwestern United States and the 24 Proposed Solar Energy Zones (SEZs) Analyzed in the Draft Solar PEIS. The Solar Insolation Values are indicative of resource potential for utility-scale solar energy projects. Solar Insolation Data Source: National Renewable Energy Laboratory.
This article as a PDF.
New spatial data and advancements in GIS tools allow much more comprehensive and quantitative analyses of the large datasets required when making programmatic evaluations of the ecological effects of proposed activities that cover a large area or region.
Understanding the environmental impacts of proposed human developments is critical to making appropriate siting decisions and designing mitigation strategies to reduce impacts on important resources. Impact analyses conducted under the National Environmental Policy Act (NEPA) in Environmental Impact Statements (EISs) or Environmental Assessments (EAs) are intended to determine the resource-specific impacts of proposed activities of federal agencies and their alternatives using the best available information.
Impacts to ecological resources are often a primary focus of these analyses. Information used in NEPA analyses include some measure of the known or probable presence of plants and wildlife in the project area, with special emphasis placed on threatened, endangered, and other special-status species.
Site-specific information pertaining to ecological resources is usually easier to obtain for small-scale activities such as a local facility, road, or transmission upgrade project, where the ability to conduct fieldwork is more often feasible. However, site-specific data is more difficult—and sometimes impossible—to obtain for proposed activities that could affect a large area or region. These types of analyses often are considered in programmatic NEPA documents, in which a federal agency evaluates the implementation of a broad program or plan.
Under these programmatic evaluations, the exact location and size of developments are often not known. Because obtaining quantitative information for ecological resources at such large spatial scales is difficult, programmatic impact evaluations typically rely on sketchy or partial information such as recorded species occurrences, species ranges, and general habitat descriptions. However, new spatial data and improved GIS tools allow much more comprehensive and quantitative analyses using large, readily available datasets.
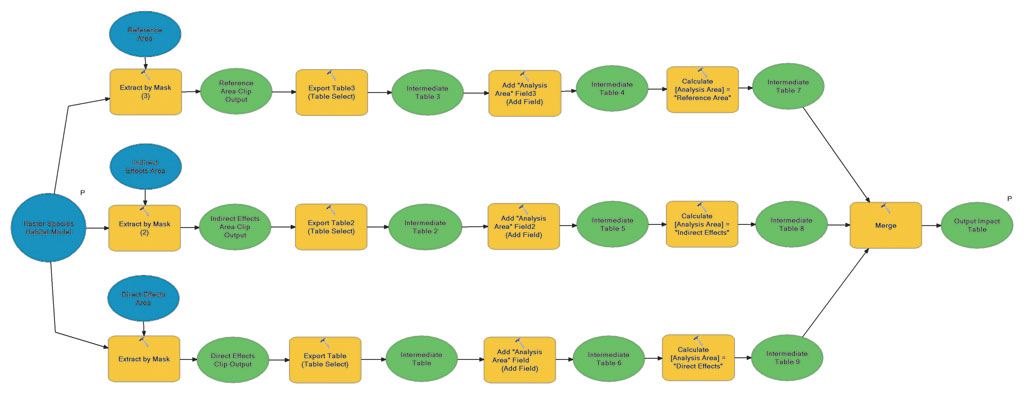
ModelBuilder diagram illustrating the conceptual workflow process for quantifying the intersection of rasterized habitat models in each analysis area
Draft Solar PEIS
This article examines a recent programmatic evaluation presented in the Bureau of Land Management's (BLM) and Department of Energy's (DOE) Draft Programmatic Environmental Impact Statement for Solar Energy Development in Six Southwestern States (hereafter referred to as Draft Solar PEIS). This Draft Solar PEIS evaluates the implementation of commercial utility-scale (10-megawatt capacity or higher) solar energy developments on BLM-administered lands in the states of Arizona, California, Colorado, Nevada, New Mexico, and Utah. The agencies identified 24 proposed Solar Energy Zones (SEZs) in the six states, comprising approximately 677,000 acres, as areas best suited for utility-scale production of solar energy.
Argonne National Laboratory supported BLM and DOE in conducting impact analyses for ecological resources using publicly available spatial data, ArcGIS for Desktop tools, and custom Python scripts developed to conduct quantitative spatial analyses of impacts on ecological resources. [Argonne is managed for the US Department of Energy by UChicago Argonne, LLC.]
Given the large geographic scale of the proposed solar program, it was not feasible to conduct site-specific field surveys for all ecological resources present in and around each SEZ. To facilitate the impact analysis in the Draft Solar PEIS, the authors developed a systematic approach that relied on geospatial data collected and maintained by state and federal natural resource agencies. Rasterized regional land-cover data and species distribution models developed from state and regional gap analysis programs (GAP) were the primary geospatial data used in the ecological impact evaluation.
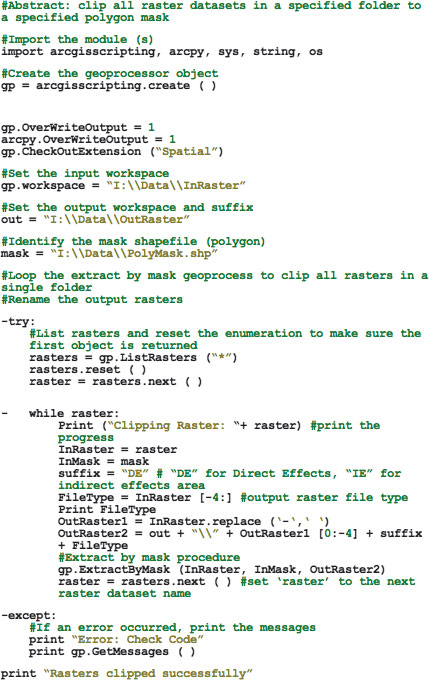
An excerpt of the Python script, written for conducting spatial analysis by looping through all raster species, predicted suitable habitat models for each analysis area.
Data Sources
Regional land-cover data for Arizona, California, Colorado, Nevada, New Mexico, and Utah in Esri Grid format came from the USGS Gap Analysis Program. Land cover was represented by 30-meter cells that described vegetation communities interpreted from remote sensing. For plants and some animal species that lacked individual habitat models, associated land-cover types were extracted and used as proxies for suitable habitat.
Potentially suitable habitat for animal species in California came from the California Gap Analysis Project. Four hundred and fifty-five wildlife species have been modeled in the California Gap Analysis Project. California habitat suitability models had a 90-meter cell resolution and were in Esri Grid format.
A raster image of potentially suitable habitat for southwestern animal species (except for California species) was obtained from the Southwest Regional Gap Analysis Project (SWReGAP), which has created habitat suitability models for more than 800 animal species. SWReGAP habitat suitability models had a 240-meter cell resolution.
Assessing Ecological Impacts
GAP habitat suitability models for more than 1,000 species of plants and animals in all 24 SEZs were evaluated in the Draft Solar PEIS. Ecological impact analyses were not discretely limited to the SEZ footprints. Rather, ecological impacts were assumed to occur as direct or indirect effects. Direct effects could result from surface disturbances associated with ground clearing, vegetation removal, and habitat loss within the SEZ. Indirect effects might extend beyond the SEZ boundary and be the result of factors such as runoff, water depletion, dust deposition, noise, degradation of water quality, and visual impacts. Indirect impacts were deemed possible within five miles of the SEZ boundary. For these reasons, the ecological impact analysis included three analysis areas—the area of direct effects, the area of indirect effects, and the reference area—that were either created or processed in ArcGIS 10.
An area of direct effects is located within the boundary of each of the SEZs and included any assumed access roads needed to serve development within the SEZ. An area of indirect effects was an area within five miles of the SEZ where ground-disturbing activities would not occur but the impacts from surface runoff, dust, and other factors from project activities could occur. The reference area, used to determine regional habitat availability, encompasses an area within a 50-mile radius from the center of the SEZ.
Quantifying the amount of potentially suitable habitat in these three analysis areas allowed a better understanding of the possible impacts in a landscape context. Direct and indirect impacts were evaluated relative to the amount of habitat available in the reference area.
The analysis of habitat models for each area began with with the extraction of the habitat model cells that intersected that analysis area using the Extract By Mask tool in the Spatial Analyst extension toolset in ArcGIS 10. Next, an output table summarizing the number of intersecting cells was created. A text field was added to the table and populated to distinguish the results of each geoprocess operation when the tables were merged. Finally, all individual output tables were merged into one database (.dbf) table.
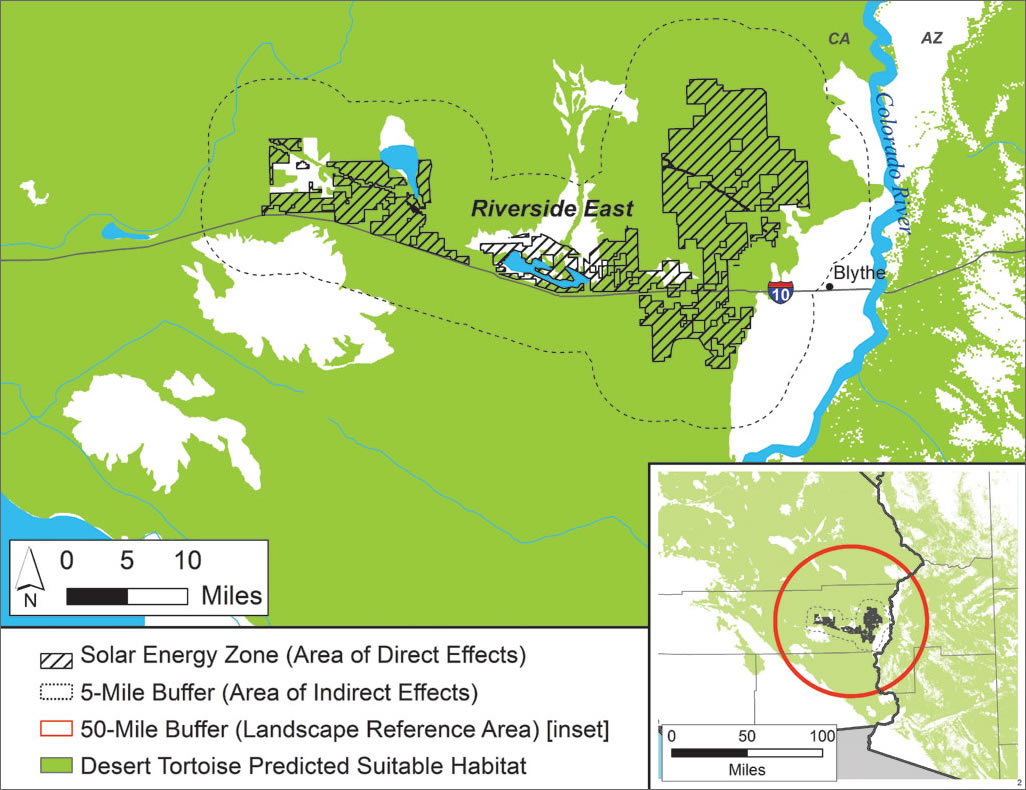
A proposed SEZ in Southern California illustrating habitat distribution models for the desert tortoise that was generated from gap analysis programs. Also shown: the area of direct effects, area of indirect effects, the landscape reference, and the three analysis areas used in the ecological impact evaluation.
Saving Time and Money
However, one significant challenge remained: the individual geoprocessing tasks required for each habitat suitability model for each analysis area were time-consuming and prohibitively expensive. Processing time for geoprocessing operations can be reduced using ModelBuilder in ArcGIS [a framework with graphic interface for automating geoprocessing tasks] in batch mode. However, this approach lacks the computational advantage of using looped procedures.
To rectify this situation and facilitate iterations of these geoprocessing operations, a Python script was developed to loop through all habitat models. First, all rasterized habitat models were stored in a common directory. The script looped through all models in the directory, extracting intersecting cells within each analysis area and outputting a summary table merged across all habitat models.
The Python script employed the arcpy.mapping and arcgisscripting modules and used the Spatial Analyst extension via gp.CheckOutExtension ("Spatial"). Although the approach was similar to that used in ModelBuilder, the main difference was that, by identifying dynamic variables and using Python script through ArcToolbox, the necessary geoprocesses were looped through the entire directory, which contained more than 1,000 habitat models, analyzing at once without additional user input, resulting in significant time savings. Running the script through a folder containing 425 raster habitat models was completed in approximately 15 minutes on a computer using a Windows 7 operating system with an Intel i7 2.93 GHz processor and 8 GB of RAM. These same geoprocesses and table edits would have taken more than 32 man-hours to complete manually. The script also reduces the risk of human error.
The resultant merged output table summarized areas of potentially suitable habitat intersected by the analysis areas. It was then used to make impact evaluations for each species. These evaluations were based on the amount of potentially suitable habitat in the areas of direct and indirect effects relative to the amount of habitat available in the landscape (i.e., reference area).

Desert tortoise (Photo courtesy of Bureau of Land Management/California)
Conclusion
The availability of large-scale regional data such as GAP land-cover models or species habitat suitability models, combined with more robust spatial analysis procedures available through ArcGIS for Desktop software, allowed the analysis of multiple datasets at large spatial scales.
This enabled researchers to surpass previous qualitative evaluations by developing a more accurate and quantitative approach for determining the environmental impacts of human activities at larger spatial scales. These approaches, combined with the utility of ModelBuilder and operability of Python scripts in ArcGIS, allow a more timely and cost-effective synthesis of available spatial data for programmatic evaluations and add a quantitative basis to environmental decision making.
For more information, contact Leroy J. Walston at lwalston@anl.gov or 630-252-3270.
About the Authors
Leroy J. Walston (main author) is an assistant ecologist at Argonne National Laboratory with more than 10 years of experience in working with GIS applications to ecological systems. His work includes spatial approaches to evaluations of energy development impacts to aquatic and terrestrial ecosystems, communities, and sensitive species. He holds a master's degree in biology from Eastern Illinois University with special emphasis on landscape ecology.
Kirk E. LaGory is an ecologist at Argonne National Laboratory and has 25 years' experience in environmental assessment and over 30 years' experience in ecological research. He has worked on a wide variety of projects examining the impacts of human activities on terrestrial, aquatic, and wetland ecosystems and threatened and endangered species. He has a doctorate in zoology from Miami University.
William Vinikour is an environmental scientist at Argonne National Laboratory with more than 35 years of experience in NEPA assessments and environmental research. His work includes evaluations of conventional and alternative energy development projects to terrestrial, freshwater, and marine species and habitats. He holds a master's degree in biology from Northern Illinois University with special emphasis on environmental science.
Robert Van Lonkhuyzen is an ecologist at Argonne National Laboratory with more than 20 years of experience in ecological research, with emphases in wetland management, plant community characterization, impact assessment, and habitat restoration. He holds a bachelor's degree in biology from Trinity Christian College. He is currently conducting assessments of impacts to wetlands, threatened and endangered species, and terrestrial communities. His research interests include wetland management and mitigation; habitat delineation and classification; and restoration of wetland, woodland, and prairie communities.
Brian Cantwell is a senior GIS programmer/analyst at Argonne National Laboratory with 28 years of experience in cartography and GIS. His work includes geospatial data management and analysis, development of land-use alternatives, and dissemination of data in support of major programmatic environmental impact statements. He holds a bachelor's degree in forestry from Southern Illinois University.