ArcUser
Spring 2012 Edition
Modeling the Terrain Below
Creating dynamic subsurface perspectives in ArcScene
By Matthew DeMeritt, Esri Writer
This article as a PDF.
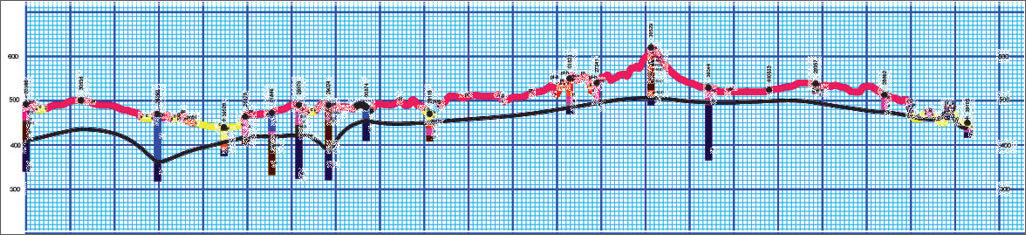
2D cross section digitally edited in ArcMap

Converted to 3D polygons and lines for ArcScene
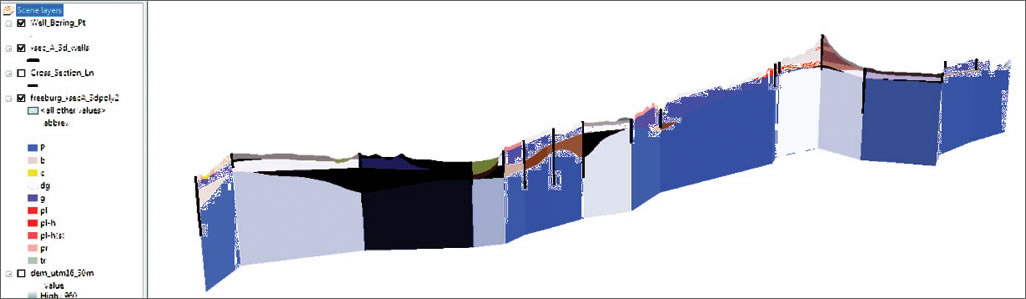
The process of creating geologic cross sections in ArcGIS from 2D in ArcMap to 3D in ArcScene using Xacto program output
A GIS and graphics specialist for the Illinois State Geological Survey (ISGS) developed GIS tools that help visualize subsurface geology.
Since William Smith's first modern geology map in 1815, geologists have portrayed 3D data on 2D maps using cross section diagrams. These diagrams show the strata of the earth's crust like a slice of layer cake viewed edgewise, giving geologists a valuable perspective of the earth's subsurface. Today, cross sectioning remains an important intermediate step in visualizing what is beneath the ground in true 3D.
Before the widespread use of computers, creating dynamic 3D views of the ground below was practically impossible. Today, earth scientists have more information about the subsurface than ever and sophisticated software systems to analyze and manage it. This has opened up new possibilities for generating 3D perspectives of the underground world.
The Perils of Manual Cross Sectioning
In 2007, Jennifer Carrell, GIS and graphics specialist for ISGS, Prairie Research Institute, University of Illinois at Urbana-Champaign, recognized the need for improving the process for making the cross sections shown on ISGS maps. At that time, most of the geologists still drew cross sections by hand and gave them to Carrell to digitize in ArcGIS. This hand-drawn method often included mistakes that were time-consuming to correct.
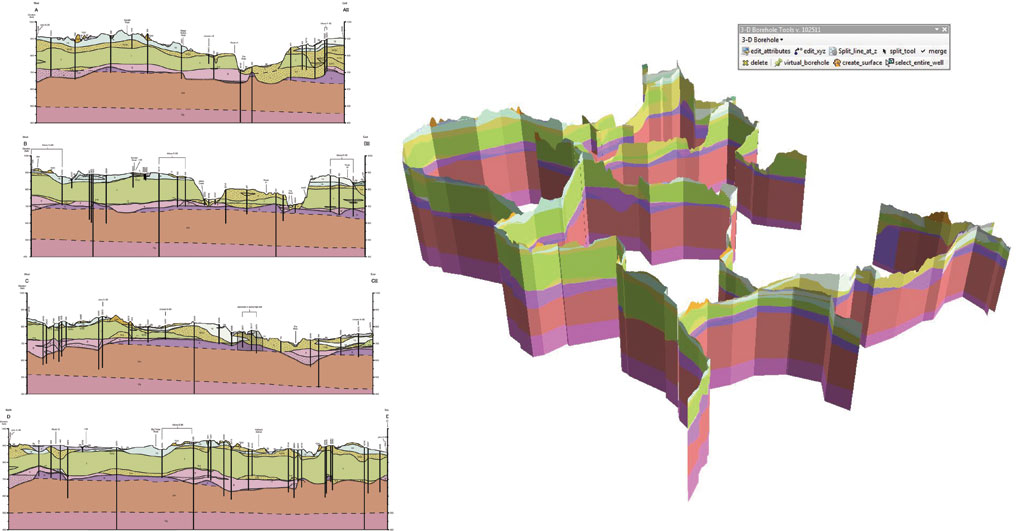
Left: Cross sections from a published paper map. Right: Cross sections viewed in 3D in ArcScene.
"Each inaccuracy in a cross section propagates throughout the map and can usually be traced back to some step in the manual process," said Carrell. "For example, if the location of one geological contact on a cross section is off by 50 feet, the contacts farther down the line of the section will likely also be off by at least 50 feet. The ideal solution would be to feed the data into ArcGIS and let it automatically create the framework for cross sections." Carrell saw a need for a solution that used the combined capabilities of native tools in ArcGIS to generate both 2D and 3D viewable cross sections much faster than ISGS had been producing them.
Xacto Section
Using Visual Basic, Carrell created a tool that generates a 2D cross section profile as a collection of polyline and point shapefiles that can be digitally edited in ArcMap and/or exported to Adobe Illustrator for finishing. "Sensor data, such as that acquired with lidar, can give us a very accurate profile of the land surface, while ground-based geophysical techniques, such as natural gamma radiation logging, can help us estimate the thickness of each layer below the surface with reasonable precision." Completed cross sections can be exported as 3D vector features for viewing and editing in ArcScene. Carrell dubbed her tool Xacto Section for its ability to virtually slice into the earth and compute a more exact profile of the subsurface.

3D boreholes can be combined with cross sections in ArcScene.
Carrell researched other software programs that help automate the drawing of cross sections but found them either too expensive or too cumbersome to fit into the existing map production workflow.
Borehole Forest
Mapping subsurface geology is akin to trying to solve a jigsaw puzzle with 90 percent of the pieces missing. A significant portion of geologic data comes from boreholes drilled for engineering purposes or for water, coal, oil, gas, or mineral exploration. With enough of a sampling, distinct geologic layers can be identified based on their composition.
Encouraged by the results of Xacto Section, Carrell set out to create similar tools for graphically displaying borehole data that could take advantage of the 3D visualization capabilities of ArcScene. With 3D Borehole tools, geologists working in ArcScene can visualize boreholes together as a 3D "forest" of vertical cylinders or tubes, instead of boreholes being symbolized as lines on a 2D diagram.
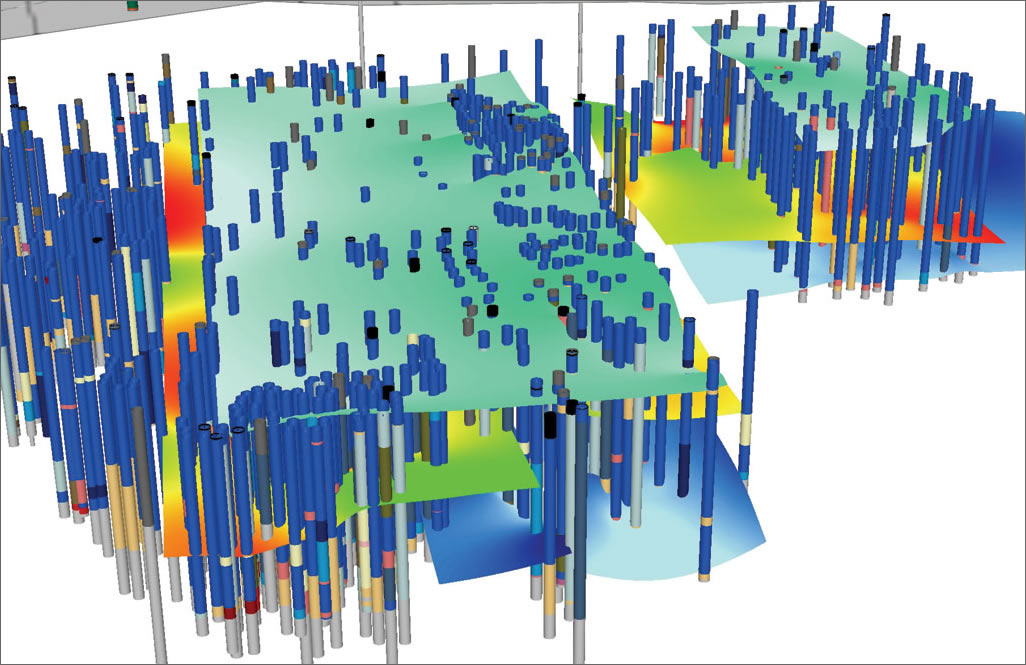
Boreholes and surfaces interpolated from borehole selections
"The 3D Borehole tools in ArcGIS allow the geologist to take tabular borehole data in the x,y,z attribute form and visualize them as 3D tubes in ArcScene," said Carrell. Using 3D Borehole tools in ArcScene, geologists can easily manipulate borehole log descriptions and geophysical data, which are then classified and interpreted by the geologist as mapping units. From there, they interpolate surfaces from point data and begin constructing a working conceptual model of geologic layers in a given area.
Initially, Carrell created the cross section tool mainly for 2D cartographic purposes. As ISGS accumulated GIS files for its cross sections, Carrell began to convert them into 3D and display them together with the 3D boreholes in ArcScene. In this way, they become not just a static cartographic product but valuable input data that can be used to map the geology of nearby areas. "Making the leap from 2D to 3D visualization has been really exciting for geologists at the ISGS because it provides a sense of depth required to understand complicated sequences of sediment," said Carrell.

Left: Diagram of a continental glacier and some associated landforms. Right: A sidelong view of boreholes reveals sand and gravel (orange and yellow segments) of a former delta and a moraine (blue segments).
In Use
At ISGS, geologists use the tools to construct 3D models of subsurface geology at the county or regional scale. These models help governments and water utilities create water supply plans, especially in the fast-growing counties around Chicago. Being able to visualize the geologic materials in 3D has been invaluable to geologists in mapping the sand and gravel deposits that are potential sources of groundwater for drinking, agriculture, and industry.
As the geologic record revealed in boreholes shows a record of climatic change in the past, visualizing that data three-dimensionally similarly benefits climate research. Carrell currently works with members of ISGS studying the glacial geology of Illinois. "Being able to view borehole data together in 3D, they can more easily discern the shapes of glacial landforms such as fans, deltas, lakes, and channels," said Carrell. "This helps them piece together a more detailed story of how glaciers advanced and retreated across the landscape over the past two million years."
In addition to benefiting hydrology and climate research, Carrell's tools also inform civic planners and policy makers. Having more dynamic perspectives of the extent of aquifers or the location of potential house-swallowing sinkholes ultimately improves investigation and lessens risk. "Communicating our results in 3D makes a huge difference in terms of audience impact," said Carrell. "As a geological survey, anything we can do to make our scientific interpretations more precise and accessible benefits the public."
Since posting the tools on ArcScripts, Carrell's mapping tools for ArcMap and ArcScene have been downloaded nearly two thousand times. She has received feedback from individual geologists and agencies in Italy, Germany, the Netherlands, Argentina, and Canada, just to name a few countries. "Cross sections are used in many disciplines within earth science and planning," said Carrell. "It's gratifying to see that the tools I created meet the needs of those communities."