Understanding Past and Future Land Use
Modeling archaeological sensitivity
By J. Brett Hill, Mathew Devitt, and Marina Sergeyeva
 |
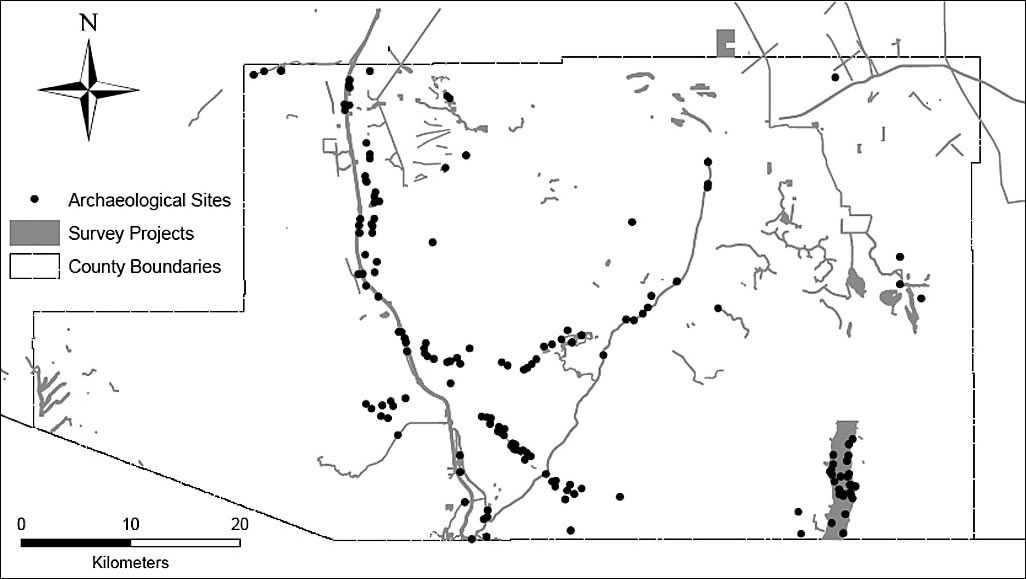
| Map showing the locations of the archaeological sites and survey projects used in the model. |
Predictive models of archaeological site location have great potential as tools for archaeologists working in cultural resource management, and the ability to model archaeological sensitivity has become increasingly practical with the development of GIS technology and the availability of digital environmental data. A recent initiative to establish a National Heritage Area (NHA) in the Santa Cruz Valley of southern Arizona prompted the Center for Desert Archaeology to develop an archaeological sensitivity map of Santa Cruz County to aid in development planning. GIS data was acquired from public sources including the United States Geological Survey, the Arizona State Land Department, and the AZSITE Arizona archaeological sites database. [The Arizona State Museum, the State Historic Preservation Office, the Museum of Northern Arizona, and Arizona State University form the AZSITE Consortium.] Using this data together with ArcGIS, and SYSTAT software (a statistics and graphing package from SYSTAT Inc.) obtained through conservation grants, a predictive model was developed that proved both efficient and informative.
About the Study Area
Santa Cruz County is located in southeastern Arizona adjacent to the United States-Mexico border. It comprises an area of approximately 3,200 square kilometers (km2) of Basin and Range province topography with elevations ranging from 900 to 2,880 meters (m) above sea level. The Santa Cruz River, the area's dominant geographic feature, flows through the border and is flanked by the Santa Rita and Patagonia mountains. Except in the mountains, where evergreen woodland exists, the Sonoran and Chihuahuan desert environment dominates. Annual precipitation ranges from 300 millimeters (mm) in the low desert to 900 mm at higher elevations.
Culturally the area has been the location of human habitation since the early stages of New World occupation up to 13,000 years ago. It is also the location of early agricultural sites and a setting for the introduction of domesticates to the region as much as 4,000 years ago. During the last centuries before European contact, the area was on the border between the Hohokam and Trincheras culture areas, and when the first European explorers arrived, the area was occupied by native Piman groups, whose descendents still live here. Overall, there is good evidence that some parts of the area were occupied fairly consistently for several thousand years, and many areas of occupation in earlier times are still important in contemporary land use.
The Project
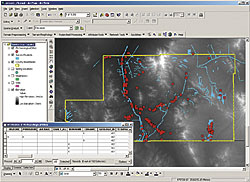 |
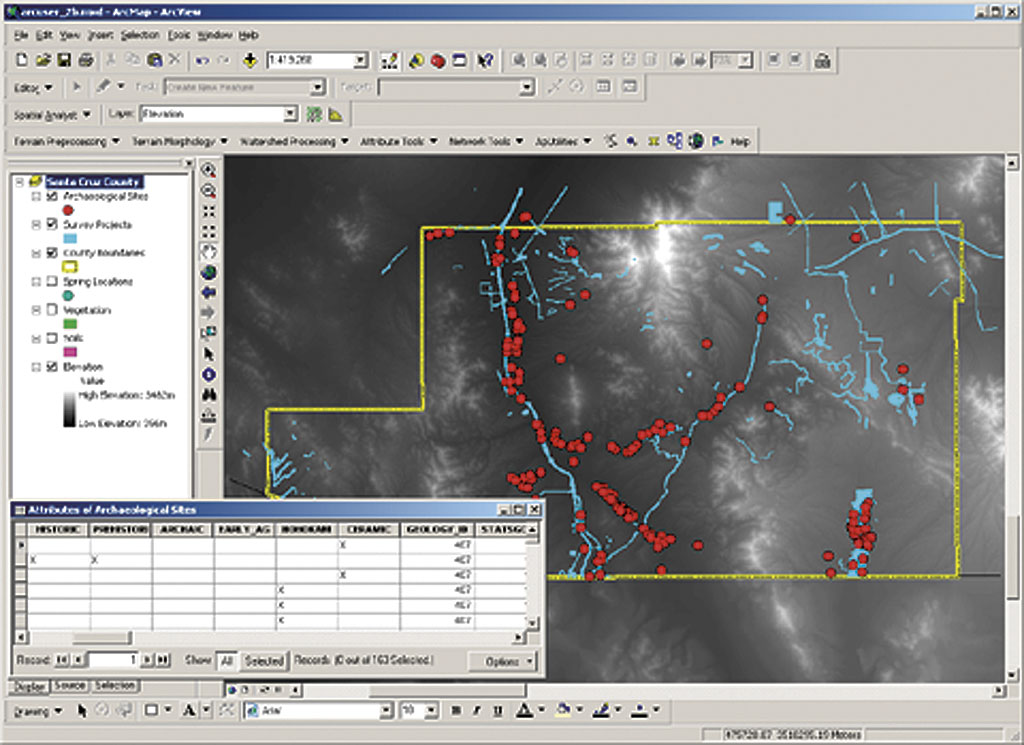
| Archaeological sites and survey project locations shown on DEM background. |
A goal in creating a sensitivity map of this area was to illustrate the integration of natural and cultural resources and provide a sense of their value in a set of interpretive themes that highlight the area's distinct heritage. Of these 10 themes focused on the unique biological and cultural qualities of the area, two—Native American Lifeways (11,000 B.C. to present) and Desert Farming (2,000 B.C. to present)—are related to prehistoric settlement and land use. Most themes also emphasize various aspects of life along the river oases that are so prominent in this desert environment and provide the unifying principle for NHA. Demonstrating the archaeological aspects of this relationship between land use and the Santa Cruz River system was a key focus of the analysis.
The larger goal in obtaining NHA designation was the development of heritage and nature tourism in the area. Over the first 10 years, the impact of increased tourism resulting from the NHA designation is estimated at approximately $1.8 billion in revenue and 40,000 new jobs. To most effectively manage this development and its impacts, it is necessary to illustrate where cultural resources are concentrated, their relationship to other resources, and how they will be affected by increased tourism activity.
GIS and Statistics
The statistical technique used for this predictive model was the logistic regression technique, described by K. L. Kvamme in a 1983 article (see References), which provides output ranging from 0–1 that can be interpreted as a probability. Logistic regression is suitable for use with binary-dependent variables and a range of independent types including categorical variables common in environmental studies. For site locations, a set of 160 pre-European contact habitation sites was obtained from AZSITE. These sites were chosen because they were likely to represent the broadest range of activities relevant to the interpretive themes and were most representative of past land-use and cultural resources that need protection.
For nonsite locations, a set of archaeological survey polygons was obtained from AZSITE comprising 148 projects covering more than 70 km2 and representing approximately 2 percent of the area of Santa Cruz County. A nonsite was defined as any area where survey work did not reveal the presence of archaeological resources. Nonsite areas were converted to point locations to create a dataset with attribute association comparable to site locations. This process resulted in the identification of 310 nonsite locations distributed broadly across Santa Cruz County.
Obtaining and developing useful environmental data can be the most time-consuming and costly aspect of a predictive modeling project. Project constraints required the use of available data that was typically collected for quite different purposes and recorded at a scale that might not be appropriate for modeling some aspects of prehistoric land use. Consequently, it was necessary to derive meaningful attributes from this data while still discriminating statistically useful variation.
Looking at Water Availability
One especially important consideration in site location is difficult to address with standard hydrographic data. This is the availability of water. In the deserts of the Southwest, this was an important consideration for prehistoric settlers. It is difficult to identify this concern with current data in a way that reflects actual availability. Hydrographic data available from government sources typically does not adequately indicate subtle variations in water availability in the desert nor does this data address differences between current and past conditions. Simple distinctions between perennial and ephemeral streams, or methods of identifying stream order, do little to indicate the actual quantity and timing of water availability that are critical to human uses. Furthermore, surface water availability has changed greatly over time, particularly in the last century, because modern uses have affected flow characteristics and the water table.
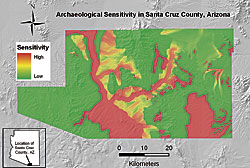 |
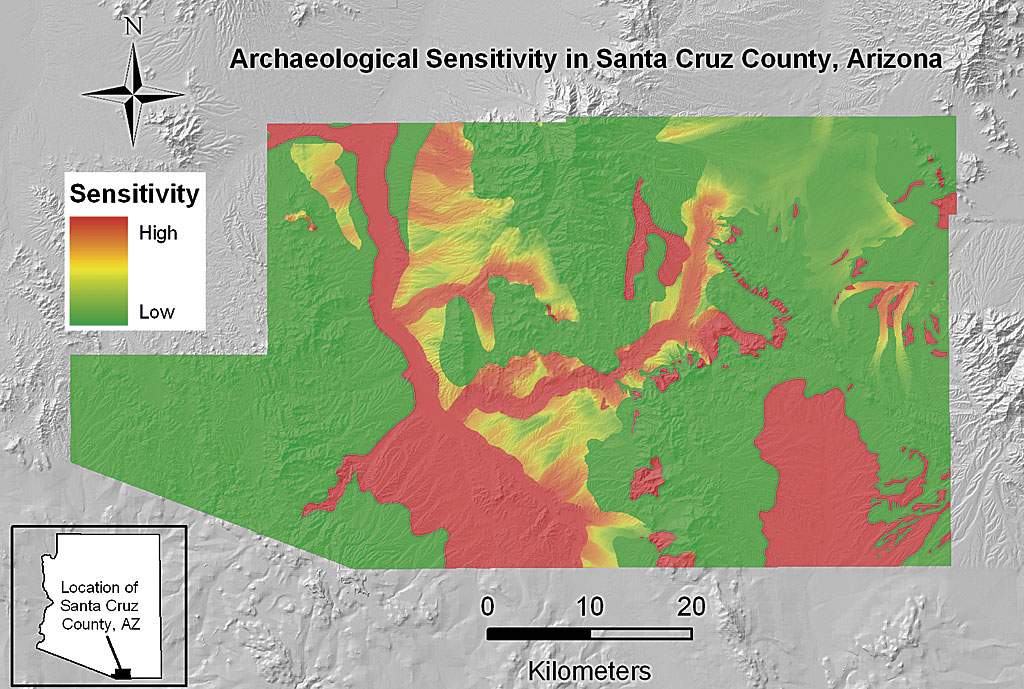
| Map of the results of the BIC approximation model showing areas of archaeological sensitivity in Santa Cruz County. |
For example, in the present analysis, only two small segments of the many streams in the area were identified as perennial; the rest were considered ephemeral. However, a more extensive perennial flow in the larger streams of this region has been historically well documented. In addition, the mean distance to any stream from sites used in these analyses was 294 m, compared to 303 m for nonsite locations. Such a small difference in distance to ephemeral water sources hardly reflects its importance in this desert region and would provide little utility in discriminating among likely settlement locations. In the absence of an expensive paleoenvironmental study of past fluvial conditions, hydrological modeling using the ArcGIS Spatial Analyst extension and the Arc Hydro data model offered the best way to understand the relative availability of water to prehistoric settlers.
Hydrological modeling characterizes the direction and accumulation of flow based on terrain. The size of watershed is one of the most important factors affecting the amount of water that flows in a given drainage. Based on the slope and aspect of each pixel in relation to its neighbors in the digital elevation model (DEM), it is possible to calculate the total area that flows into each location, or its flow accumulation. This is a quantity most usefully described as a neighborhood statistic, as sites were typically situated near, rather than in, locations of high accumulation.
A neighborhood sum was used to indicate the total area of watershed contributing to hydrologic flow within 1 km of a site location. This measure characterizes the amount of flow available in close proximity to a settlement and reflects variable availability as the distance from sites to drainages increases. The calculation of the neighborhood statistic resulted in a mean flow accumulation in the vicinity of sites that is more than 127 times greater than the mean flow accumulation for nonsite vicinities and appears far more indicative of the variable availability of water and its relative importance in this environment.
Choosing the Most Appropriate Model
Attributes of environmental variables were assigned to the collection of sites and nonsites by location to produce a table for statistical analysis. An important problem in multivariate statistical models is how to determine which variables will provide the best model. Some discussion in the archaeological literature suggests using stepwise procedures, adding or removing variables based on a predetermined significance value. This procedure has been criticized, however, and the Bayesian Information Criteria (BIC) approximation (Raftery 1995) offered a useful alternative for distinguishing the best set of variables for creating an efficient predictive model. For this project, BIC approximation indicated that a set of variables including flow accumulation, elevation, distance to springs, soils, and vegetation provided the best model. Further tests of this model against models suggested by stepwise procedures indicate superior performance of the BIC model.
Results and Discussion
The resulting predictive model provided mean probability estimates of .97 for site locations and .03 for nonsite locations, indicating strong discrimination between location types. Reclassifying the probability map, so values above .5 are positive predictions and values below are negative, correctly predicted 98 percent of the sites and 98 percent of the nonsite locations. A more efficient model correctly predicted at least 90 percent of the site locations by reclassifying positive and negative predictions at a .96 cutpoint that focused attention on only 21.4 percent of the total area as archaeologically sensitive. This model represents a 76 percent gain in efficiency in identifying areas of interest for cultural resources. Moreover, it is in stronger agreement with other models of natural resources, such as biodiversity, that are also an important part of the NHA.
Despite the present need for a single model, it is essential to consider modeling as an ongoing, iterative process. The current project is only a feasibility study and will be followed by continued efforts as the NHA designation advances. Ultimately, more detailed management plans may require more elaborate modeling efforts and the consideration of new variables as necessary to clarify understanding of particular problems and relationships.
Also, understanding the archaeology of this region will certainly improve as more research is conducted in coming years. As development expands greatly in the area, it will change the articulation of past and present interests. The present model cannot be considered a final word on archaeological sensitivity in Santa Cruz County. Rather, these efforts and the lessons learned will, it is hoped, serve as a productive foundation for continued work. It is encouraging that this initial project has offered a useful model and numerous valuable insights into the modeling process. For a more detailed description of this project, visit www.cdarc.org/pages/national_heritage/areas/scnha.php.
Acknowledgments
The authors thank William H. Doelle for the support necessary to conduct this research and pursue the establishment of the Santa Cruz Valley National Heritage Area. They also thank Chip Colwell-Chanthaphonh, Jeffery J. Clark, Patrick D. Lyons, Miller McPherson, Anna A. Neuzil, and Linda J. Pierce for their thoughtful comments on this research.
References
Kvamme, K. L., 1983. "Computer Processing Techniques for Regional Modeling of Archaeological Site Locations," Advances in Computer Archaeology, 1:26�52.
Raftery, A. E., 1995. "Bayesian Model Selection in Social Research," Sociological Methodology, 25:111�163.
About the Authors
J. Brett Hill holds a doctorate in anthropology from Arizona State University. He is a preservation archaeologist at the Center for Desert Archaeology in Tucson, Arizona, and a visiting assistant professor of anthropology at Hendrix College in Conway, Arizona. His interests are in GIS, human ecology, and land use in desert environments. He can be contacted at bhill@cdarc.org.
Mathew Devitt is a master's student in anthropology at the University of New Mexico, Albuquerque. His interests are in ceramic analyses and the late prehistory of the southwestern United States and northwestern Mexico.
Marina Sergeyeva is a master's student in anthropology at the University of Illinois, Urbana-Champaign. Her interests are in GIS and Paleolithic archaeology in Russia.
|