Summer 2009
Summer 2009 |
||||||||
|
|
||||||||
Darrell G. Schulze, professor of soil science, and Phillip R. Owens, assistant professor of soil geomorphology and pedology, coteach the class Soil Classification Genesis and Survey. They incorporate the latest version of ArcGIS to study the relationships between soils, topography, land use, and geology. Using GIS in the classroom and in the field helps students better understand soils and the landscapes in which they occur and recognize geological features that indicate different soil types. At the beginning of the class, most students know little about geography and GIS, but by the time they complete the course, they are able to access geographic data and view it with GIS tools. The teachers use GIS to share data with the students who, in turn, use it to observe different points in the landscape. Schulze accesses the U.S. Department of Agriculture (USDA) soil survey data as well as data from the Indiana Spatial Data Portal and the Indiana Geological Survey. "This data is robust," notes Schulze. "In 2007, the USDA completed digitization of soil data for Indiana, so I can access soil data for any county in the state." Schulze downloads this data along with high-quality aerial photography and high-resolution digital elevation model (DEM) data. Using GIS, he aggregates the data into files that fit class objectives. For example, he created a dominant soil parent material model that groups polygons so that students can see relationships that are not readily apparent from traditional representations of soil survey data. With GIS, students are able to visualize the geomorphology of their study area. Owens stated "Students easily relate to the features they can see while they are standing in a field; however, larger landscape features that occur over kilometers are much more difficult to immediately understand. Teaching soil geomorphology using Tablet PCs and GIS provides the students with tools to see relationships over large distances and has revolutionized our ability to teach spatial relationships."
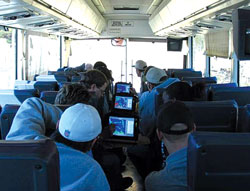
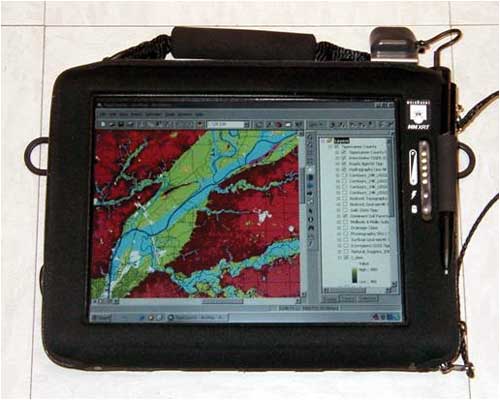
Students can see, for instance, that Purdue is located in a part of the world that was glaciated 20,000 years ago and understand close correlations between the soil parent material and the surficial geology. The DEMs highlight relevant topographic variations. By comparing this with soil data, students make conjectures about how geological phenomena have affected soils. They can see, for example, that soils formed on dense glacial till that was smeared down and compacted by the ice as the glacier moved along its path are wet because the water cannot move readily through the dense till. Sandy and gravelly soils that formed on the outwash that was deposited by the rapidly running water from the melt are better drained, and they do not have a high water table in the winter like the soils on glacial till. GIS shows how the difference in the internal soil drainage class of those soils is influenced by the different parent soil materials. In the classroom, students become familiar with basic viewing features such as zoom in, pan, and toggling layers on and off as they begin to review datasets and relationships. They also see how to access data with ArcExplorer and import it into their map projects. During weekly three-hour lab periods, the class goes on short, local field trips near campus to examine soil pits and study soil types. Students take along assigned ruggedized Tablet PCs loaded with ArcGIS and integrated with GPS receivers. Later in the semester, students participate in two all-day field trips. They travel by bus from Lafayette, Indiana, north to Lake Michigan on the first trip and as far south as Bloomington, Indiana, on the second. Class time is continued while traveling on the bus, and students are literally oriented as they follow their routes via the GPS and ArcGIS interface on their Tablet PCs.Students can explore the lesson and make observations on their PCs.
"While we are traveling to our destination, I use GIS displaying the outcome on a monitor mounted in the bus. We can show them how to read the landscape," Schulze explains. "They learn that a slope or a particular shape of a hill was formed by a particular geomorphic process and can then deduce the material that is underneath." For instance, they learn to recognize an esker, which is a long, skinny hill that has sand and gravel under it where there was once water flowing under the ice. Using their Tablet PCs, they can compare the virtual esker with the landscape before them. GPS indicates, in real time, where they are on the map, verifying their interpretation of what they are seeing. Purdue is located in Tippecanoe County, which is the easternmost boundary of the prairies of the Great Plains. In the western half of the county, a lot of the soils have been formed under prairie vegetation, giving them dark-colored surfaces. In the eastern half of the county, soils formed under forest vegetation have a lighter color. Prairie soils tend to be slightly better for growing crops because they are higher in organic matter, and overall, topsoil has better physical properties. Forested soils are more prone to crusting. This type of soil identification can help agronomists predict yield. The available data, map products, and models improve with each new class. Schulze is currently working on an application in which students can click on a polygon to query the attribute table as well as click on a link that leads them to a schematic diagram of a soil profile that illustrates what the soil looks like below the surface. "Two approaches can be taken in using GIS for education," explains Schulze. "One is teaching about GIS and how it works and the other is using GIS to teach agricultural concepts." In the latter, teachers design maps for students and put them into a format that works well for the specific class. The data is preassembled and put into a format that works easily for the student and helps the teacher focus precisely on the topic. Students' hands-on use of GIS-loaded Tablet PCs reinforces concepts from the lecture. Schulze concludes, "GIS is helping us to teach concepts in our class that would otherwise take students years of field experience to acquire." |