ArcUser Online
Summer 2011 Edition
Lighting Up and Flexing at DevSummit 2011

Participants and a lively gallery of spectators feasted on hot pretzels and cookies during the Light Up the Night Challenge.
This article as a PDF.
If you give a developer a free T-shirt, you might get an innovative app or widget in return. That was the idea behind two recent developer challenges sponsored by Esri. Both contests, the Light Up the Night Challenge and the Flex-a-Widget Challenge, resulted in many unique and inventive ideas and helped showcase some amazing developer talent in the Esri community.
The Light Up the Night Challenge
The Light Up the Night Challenge was a live, on-site event held during the evening of March 7, 2011, at the Esri Developer Summit in Palm Springs. Developers used the ArcGIS API for Silverlight to build web applications or mobile apps for the Windows Phone. Participants gathered in a theater-style room and were given three hours to solve one of three challenges.
Art Haddad, a lead software architect at Esri, served as master of ceremonies, while the entire Silverlight team was on hand to answer questions and provide support. Even though the weather outside was uncharacteristically cold, with sputtering rain, the atmosphere inside was warm and energetic. Everyone, including a lively gallery of spectators, feasted on hot pretzels and cookies while the participants coded into the night. All Light Up the Night Challenge participants and spectators received a free Light Up the Night T-shirt.
The first-place application, the NREL Wind Turbine Potential (Western US) application, was created by Jarrod Skulavik. Judges were impressed with the extensive and exceptional patterns and practices demonstrated in Skulavik's application code. His winning app used a service to access a SQL Azure database, which contains data on wind turbine potential for the western United States. The app used SQL Azure with Geography Types, RIA Data Services Toolkit with JSON and SOAP endpoints pointing to SQL Azure, ArcGIS API for Microsoft Silverlight, Entity Framework (LinqToSQL), jQuery, and AJAX (xmlhttp).
Oren Gal's earthquake proximity search app took second place. The judges thought that Gal's winning application, which geolocates a client based on an IP address and shows nearby earthquakes on the map and in a table, was very extensive and fluid.
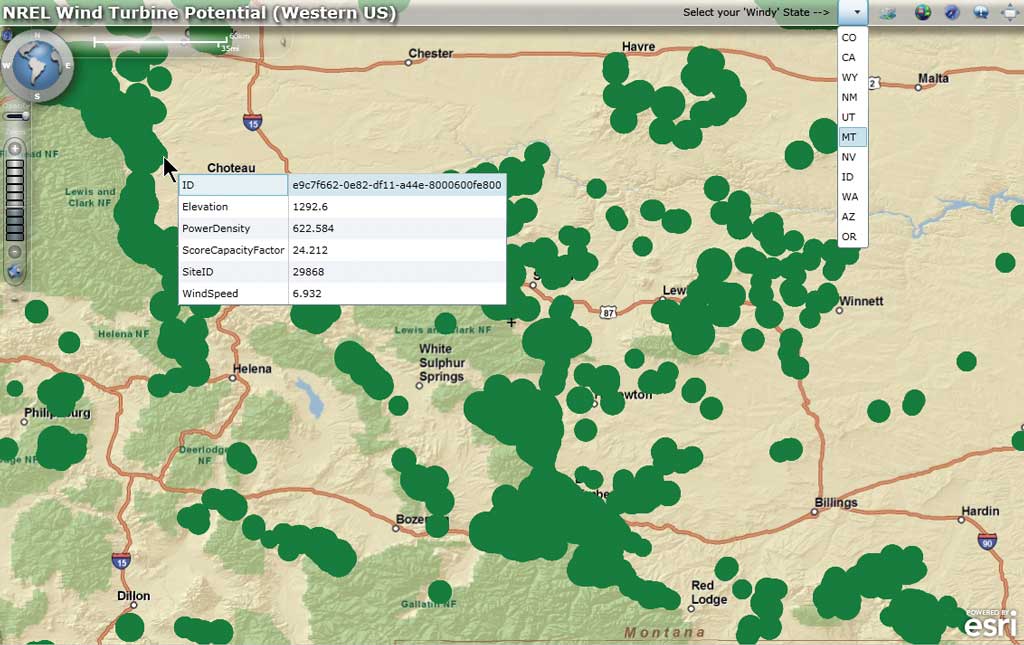
The Light Up the Night Challenge winning application—NREL Wind Turbine Potential (Western US) by Jarrod Skulavik
James Oliphant's ancestral mapping application took third place. Oliphant's application made it possible to find the geographic location of ancestral records via genealogy data provided by the Church of Jesus Christ of Latter-Day Saints. The information was displayed on a map with attributes available as MapTips.
Oliphant, GIS software engineer for Esri Platinum Tier partner Azteca Systems, Inc., said, "I recently began working with family history data, and this was a great opportunity to better visualize my family tree. I extracted unique US birthplaces from my GEDCOM file, used Esri's online locator service to determine the x,y locations, and displayed the graphics with an option to turn clustering on and off. [GEDCOM (GEnealogical Data COMmunication) is a proprietary format developed by the Church of Jesus Christ of Latter-Day Saints for exchanging genealogical data between genealogy software.] Also, the birth locations were displayed in a list that centered the point in the map as the selection changed."
Skulavik won an Xbox + Kinect (donated by Microsoft), a free pass to next year's Esri Developer Summit, and the Light Up the Night Challenge Trophy. Both Gal and Oliphant won Windows Phones donated by Microsoft.
The Flex-a-Widget Challenge
For the Flex-a-Widget Challenge, developers from around the world were given several months leading up to the Developer Summit to design their own custom widgets for the ArcGIS Viewer for Flex. Participants from Australia, Canada, China, France, Luxembourg, and the United States shared their custom widgets via the ArcGIS Viewer for Flex code gallery. Prior to the summit, the Esri community voted for its three favorite widgets.
The ArcGIS Viewer for Flex, one of Esri's most popular, configurable viewers, is a free, downloadable mapping application. Widgets are often used to help the end user easily uncover new, supplemental information or perform specific tasks and analyses. They can be added to the viewer, usually without requiring programming.
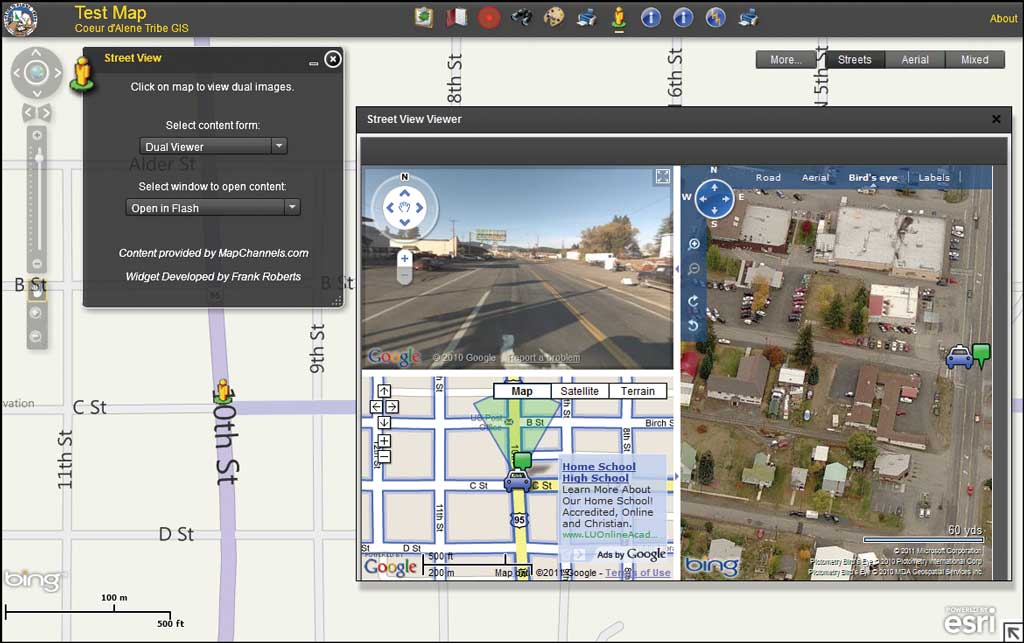
Frank Roberts' widget, Street View and More—Widget for Flex Viewer 2.2, won the Flex-a-Widget Challenge.
Frank Roberts' Street View and More—Widget for Flex Viewer 2.2 widget took the top prize. It allows ArcGIS Viewer for Flex users to explore and interact with a variety of ancillary images, such as Street View, Google Maps, and Bing Maps, by simply clicking a location on the map. For his widget, Roberts won a copy of Adobe's Creative Suite Web (donated by Adobe), a free pass to the 2012 Esri DevSummit, and a free Esri Developer Network (EDN) subscription.
Sasa Ivetic's widget, Export to Shapefile (AS3 Shapefile Writing Library), came in second. It displays a list of map services with query functionality and a list of layers for each map service. The user can export all the data in the map service or specify a query and export the results. All results are exported to a shapefile. Ivetic is a senior software developer for Esri partner Map It Out, Inc. For his efforts, Ivetic won a free pass to the 2012 Esri DevSummit and a free EDN subscription.
Andrew MacNaughton's Google Street View Widget for the Flex Viewer took third place. It adds Google Street View to a Flex viewer application and includes the most recent Flex Viewer with the Street View widget. MacNaughton won a free EDN subscription. And of course, all participants who submitted a widget received a Flex-a-Widget Challenge T-shirt.
The Winner's Circle

Jarrod Skulavik
Jarrod Skulavik
Senior Developer/Architect
XeDAR Premier Data Services

Oren Gal
"I created a Silverlight application that determined the geographic location of the client, using an IPInfoDB geolocation service, and then located earthquake history within a 300-kilometer radius. The results were shown in an interactive grid. Earthquakes were symbolized by magnitude using symbol size and color."
Oren Gal
Freelance GIS Designer and Developer

James Oliphant
"I recently began working with family history data, and this was a great opportunity to better visualize my family tree. I extracted unique US birthplaces from my GEDCOM file, used Esri's online locator service to determine the x,y locations, and displayed the graphics with an option to turn clustering on and off. Also, the birth locations were displayed in a list that centered the point in the map as the selection changed."
James Oliphant
GIS Software Engineer
Azteca Systems, Inc.
Frank Roberts
"The Street View and More widget was designed to help our clients leverage both the Google Street View data and the Pictometry oblique imagery available at Bing Maps. This widget allows the end user to view both images simultaneously by consuming data from the mapchannels.com site."
Frank Roberts
GIS Manager/Developer

Sasa Ivetic
"I decided to write the ActionScript Shapefile widget to simplify data export—a core GIS functionality missing from the Esri Flex Viewer—while avoiding the use of server-side code, geoprocessing, and ArcObjects."
Sasa Ivetic
Senior Software Developer
Map It Out, Inc.

Andrew MacNaughton
"I created this widget for ease of use. Many of the previous widgets I had downloaded were difficult to install or configure, so I wanted to post a widget that was as close as possible to copy and paste for implementation, and I think I achieved that."
Andrew MacNaughton
GIS Analyst
The Regional Municipality of Niagara