ArcUser
Summer 2012 Edition
Balancing Past and Future
Using 3D GIS analysis to route light rail through historic Mesa
By Cory Whittaker, City of Mesa, Arizona
This article as a PDF.
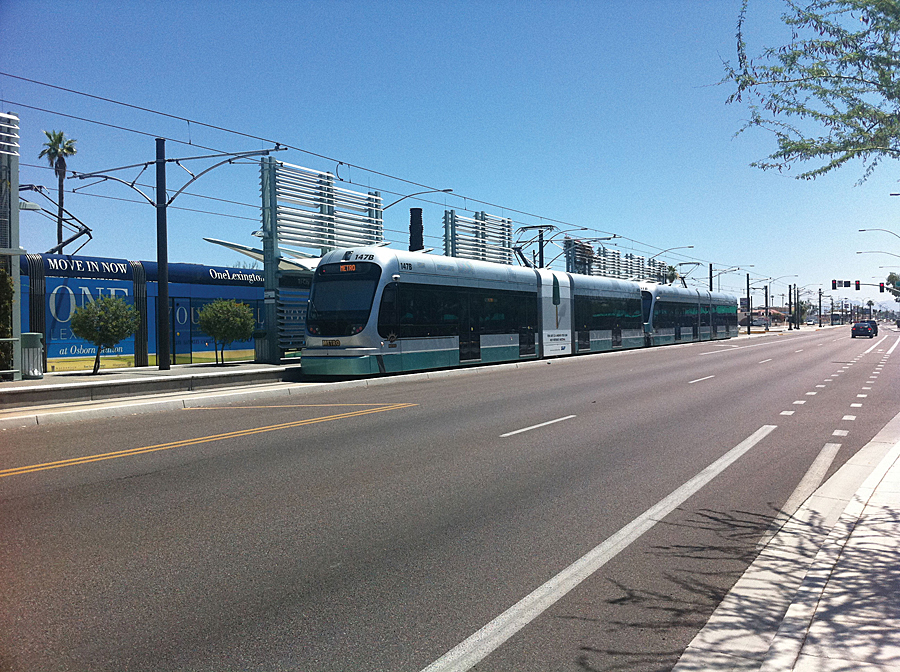
The Valley Metro Light Rail's Sycamore Station in Mesa has had the highest ridership of any station in the light rail system.
In December 2008, the Valley Metro Light Rail system debuted in the Phoenix Metro area. [Valley Metro Rail Inc., a nonprofit public corporation, operates a high-capacity transit system in this region.] In the months that followed, the City of Mesa's single station had more passengers than any other stop on the system.
When this trend continued, Valley Metro decided to expand the light rail system through downtown Mesa. This announcement was seen as a victory for revitalization efforts in the city. Neighboring cities have seen that light rail is a catalyst for transit-oriented development of nearby properties.
The proposed route takes the light rail line through the heart of downtown Mesa to cultural venues such as the Mesa Arts Center and the Arizona Museum of Natural History. The route also passes through the historical center of the city of Mesa, where buildings and places of historic significance—some listed on the National Register of Historic Places—are located.
To better understand how this project would interact with the nearby historic buildings, 3D GIS visualization tools were used. These tools gave decision makers and the public a virtual view of what downtown Mesa might look like after the light rail system was completed.
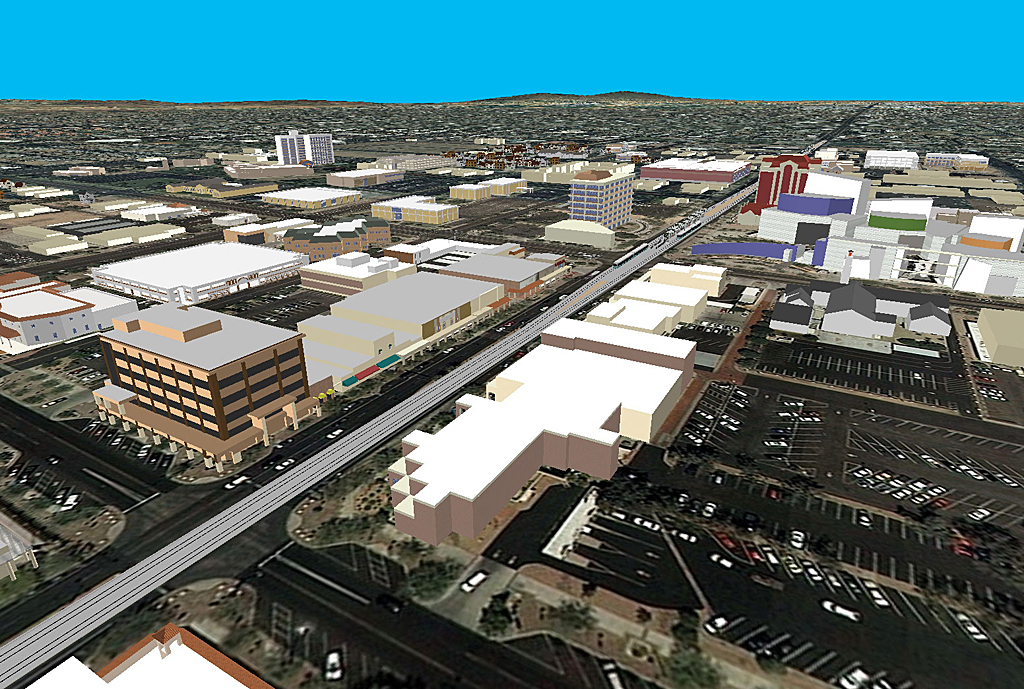
The 3D model of downtown Mesa
Modeling Downtown Mesa
Before the light rail expansion was proposed, the City of Mesa GIS staff conducted a pilot project to assess the feasibility of modeling downtown Mesa in 3D given existing departmental resources. This happened just as the economy began to nosedive and budgets were shrinking. Staff used readily available software to render Mesa City Plaza in 3D with minimal effort and cost, demonstrating to city management that modeling buildings in 3D was not only feasible but that staff members had the necessary skills. The results could be easily imported into the City of Mesa's existing Esri-based GIS system.
This successful pilot project provided the impetus to begin creating a 3D model of downtown Mesa. The first step in creating the virtual downtown was inventorying and estimating the heights of all non-single-family buildings. This inventory established a starting point for constructing virtual buildings.
Data for the inventory was collected in two ways. For some site locations, original, detailed building plans were readily available, and these were used to create individual building structures that were accurate down to the inch. For buildings that predated the city's founding, no plans were available, so oblique aerial photos were used to digitize these buildings. Although these buildings were not as accurate as ones created using detailed plans, they were sufficiently accurate for purposes of analysis. Much time and effort was expended to capture each building in enough detail so that it could be immediately recognized without a label.
Working with the Community
The city needed to establish policies for development along the light rail route. Upon completion and approval, these policies would be organized into a document called the Central Main Plan. A committee composed of city planners and local property owners, business owners, and organizations, such as historic neighborhoods and business alliances, was formed to gather different viewpoints from the community. The committee helped the city maximize the benefits of the light rail expansion.
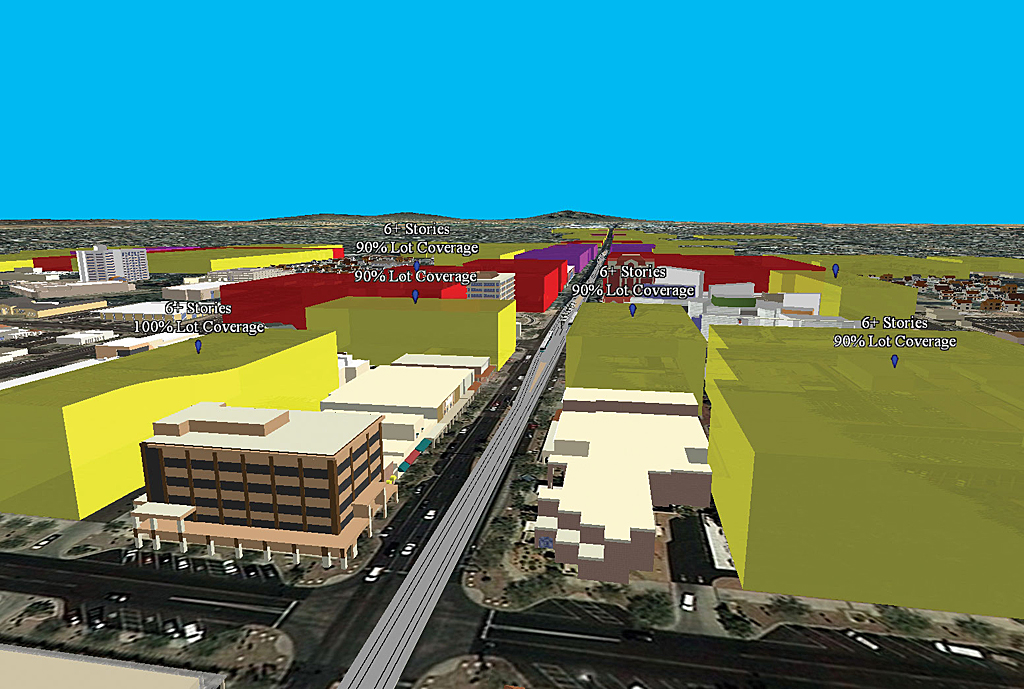
This 3D rendering shows the proposed development intensity for residential (yellow), commercial (red), and mixed use (purple). The number of stories and lot coverage for each is shown.
The committee performed one key exercise, called the Reality Check, using the 3D GIS visualization tools to answer four important questions about the future development along the light rail route:
- Where should infill and redevelopment occur?
- What areas are off limits to redevelopment?
- What will be the intensity of the development/redevelopment that is envisioned?
- Is this achievable?
With these questions in mind, committee members were asked to map where they would put 4,000 dwelling units and 1.8 million square feet of nonresidential floor space. Committee members could incorporate their grand ideas for downtown Mesa. After compiling the results, city planners had a blueprint of where and how much redevelopment would be possible. Parking lots, a few existing buildings, and vacant lots were identified as potential redevelopment sites.
With the redevelopment areas, number of dwelling units, and the amount of nonresidential square footage defined for each area, city management requested a 3D GIS analysis for these areas. Calculations, based on the number of dwelling units, square footage, land use, and lot coverages, showed how tall buildings would need to be to fulfill the proposed requirements. Buildings at these heights were displayed in 3D next to existing building footprints. The three light rail stations and rail tracks associated with them were also modeled in 3D. This analysis explained complex development planning criteria to Mesa citizens in an easily digestible format that helped them envision redevelopment potential along the light rail path.
At first glance, the redevelopment areas had something in common. The majority of the buildings along the light rail route in downtown Mesa front along the street with large parking lots behind them. Because most of the proposed redevelopment is slated for these parking lots, they are a blank canvas for downtown revitalization efforts.
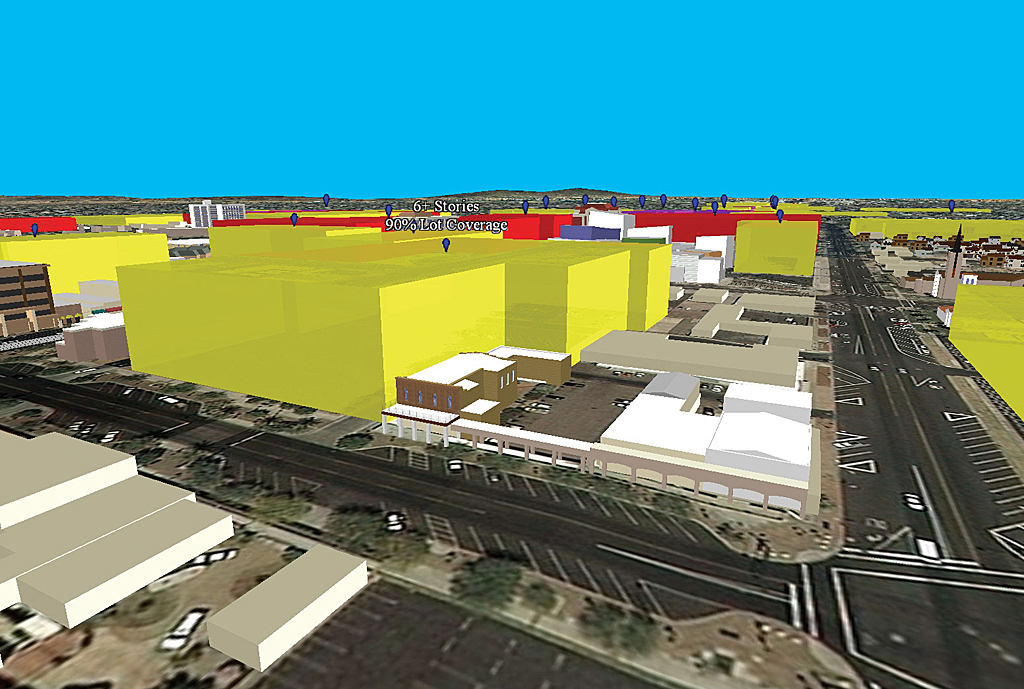
The historic Alhambra Hotel shown with the adjacent proposed redevelopment.
Seeing Today and Tomorrow
Preserving the historic character of downtown Mesa was a key priority. The Alhambra Hotel was built in 1893 and is located in the heart of downtown Mesa. Although it was partially destroyed by fire, the building was added to the National Register of Historic Places in 1993. No longer a hotel, it still has historic value and is located just south of the light rail route, next to a large parking lot that is the site of a proposed six-story building with 90 percent lot coverage. The proposed building, nearly three times taller, would dwarf the Alhambra and possibly harm its historic value.
Without a 3D GIS view, the magnitude of the disparity in the heights of these buildings would be lost. With this visualization, it was clear that caution would need to be exercised when redeveloping this site to ensure that the historic character of the Alhambra Hotel is preserved.
Light rail expansion through downtown Mesa spawned a significant 3D GIS effort that also provides potential benefits in other areas of the city. With this information in GIS, the city can conduct viewshed and line-of-sight analyses. City of Mesa Police and Fire departments want to use the 3D model in strategic planning for special events in downtown Mesa. The 3D model of downtown provides the flexibility and opportunity to model building interiors for asset management, real estate requirements, or similar purposes.
Being able to see how downtown Mesa would look with the completed light rail system and subsequent redevelopment helped the public see the benefits of having this mode of mass transit in the city of Mesa. This project has also opened the minds of city leaders and citizens to the benefits of 3D GIS analysis for standard city operations.
About the Author
Cory Whittaker, GISP, is a GIS specialist for the City of Mesa, Arizona.
Being able to see how downtown Mesa would look with the completed light rail system and subsequent redevelopment helped the public see the benefits of having this mode of mass transit in the city of Mesa.