The Automated Network Densifier Model
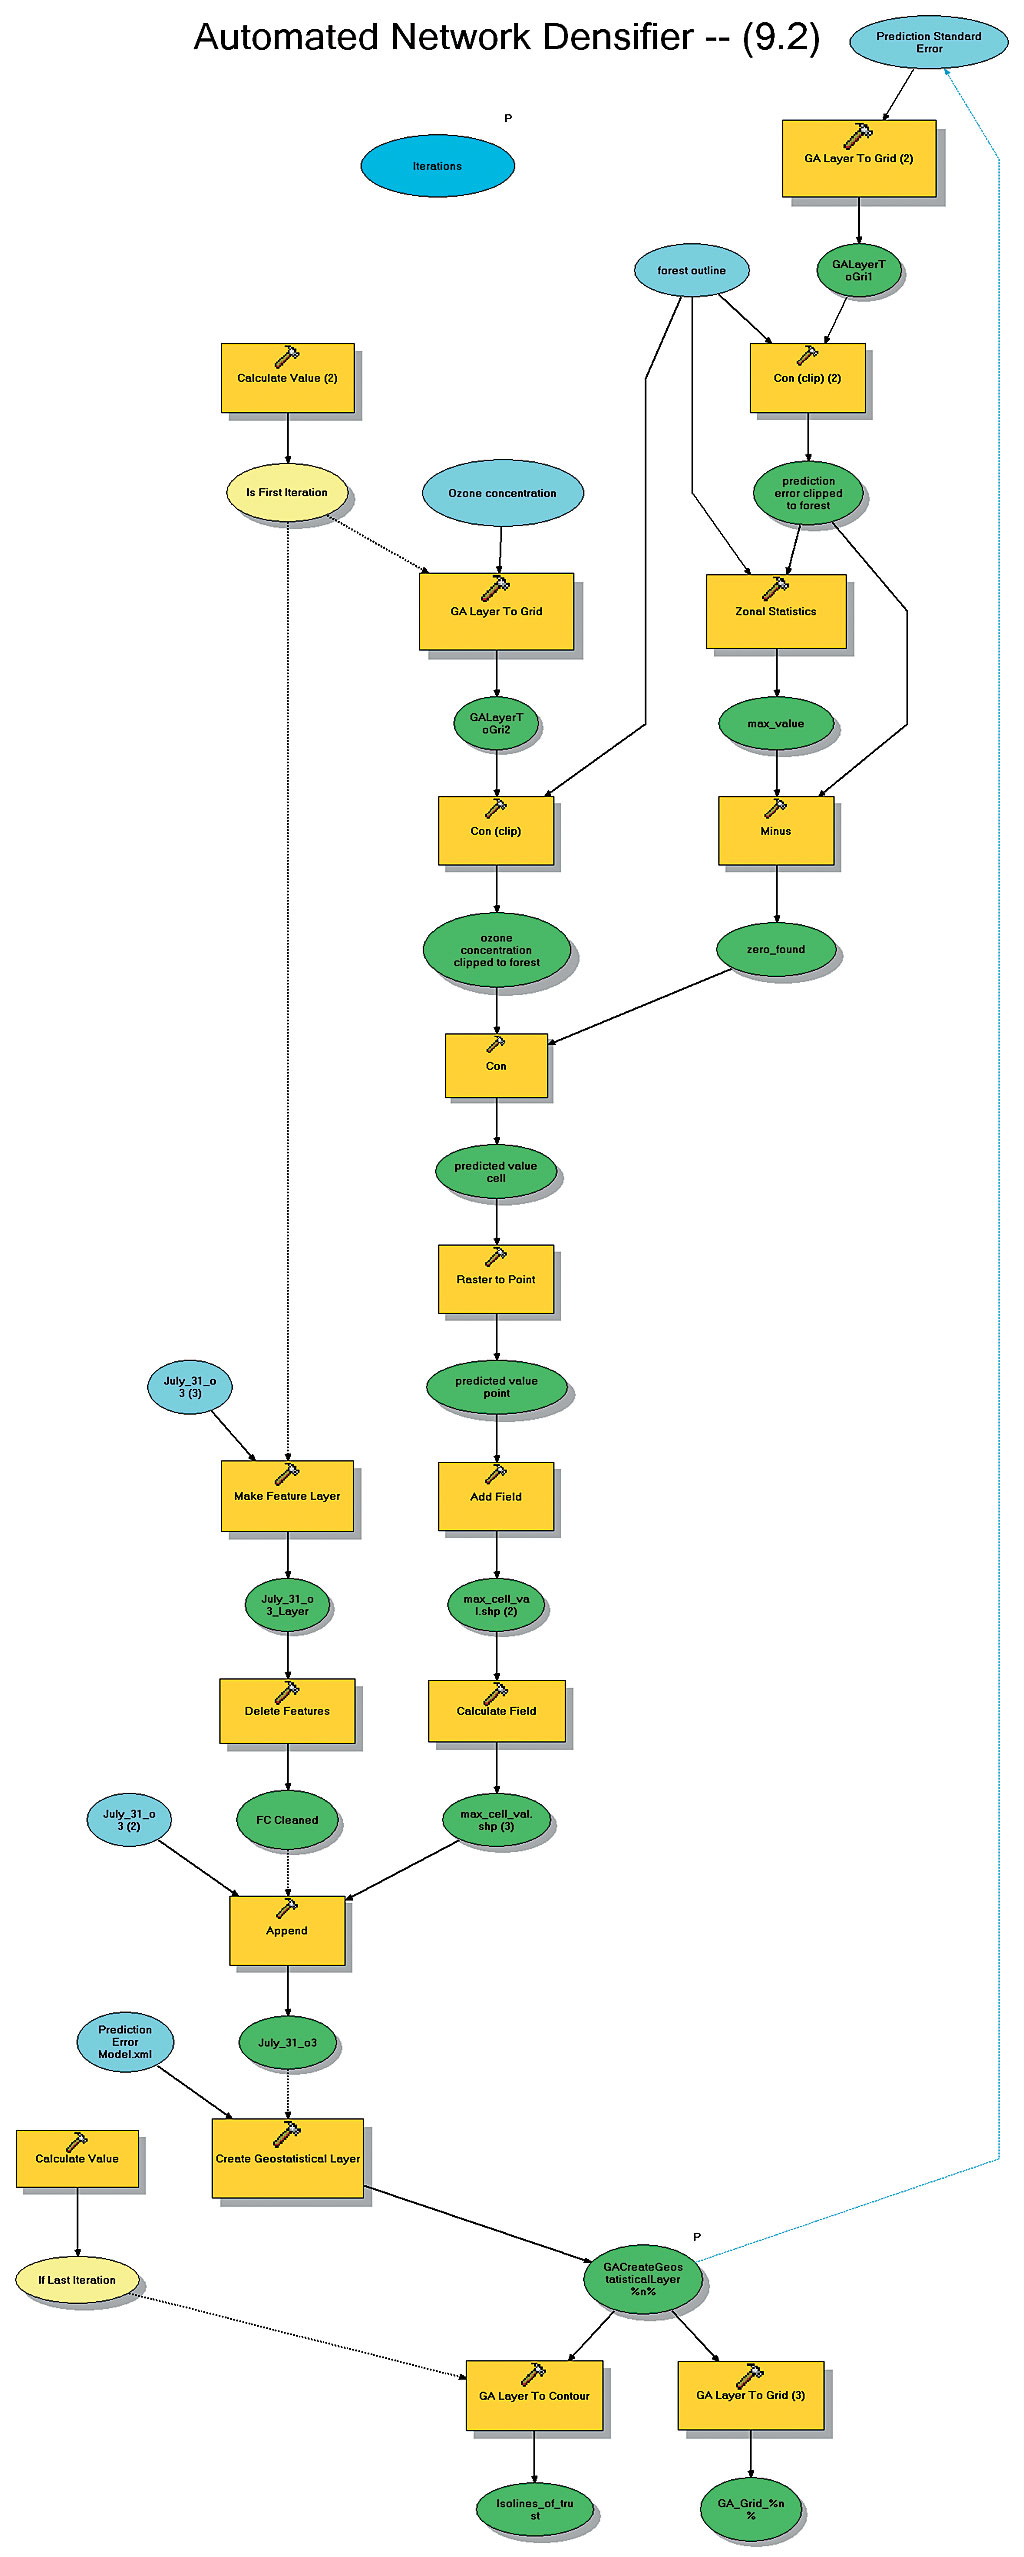
The model converts the two geostatistical surfaces to the grid raster format and clips both to the geographic extent of the study area. The maximum value on the standard error of prediction grid is found, and that cell is converted into a point shapefile with a single feature and the value of the ozone concentration as its attribute. This is the optimal point for adding a station.
In the next iteration, this feature is appended to the original sampling network shapefile and a new geostatistical layer of prediction standard error is generated from the original 31 stations plus the new stations. The XML file containing the initial prediction standard error surface parameters is used to generate each iteration. The process is repeated to identify as many network sampling locations as desired.
In addition to five input datasets and 18 utilized functions, the model consists of two preconditions. First, since the ozone concentration geostatistical layer is not changed during the workflow, it is converted into a grid only during the first iteration. Second, only the last output grid of prediction standard error is converted into isolines of equal values of prediction standard error (contours).
|