|
The Magazine for
Esri Software Users |
|
|||
Tool for Animal Feeding Operations SitingBy Elzbieta Covington, Robin "Buz" Kloot, and James B. Atkins
Animal feeding operations (AFOs) are recognized as one of the greatest threats to the quality of water resources in the United States. Potential pollutants from AFOs include nutrients, pathogens, organic matter, heavy metals, and other drinking water and health concerns resulting from Cryptosporidium parvum, a protozoan parasite, and Pfiesteria piscicida, a toxic dinoflagellate. To protect public waters, South Carolina and a number of other states have promulgated regulations on animal facility siting and land application of animal wastes. National attention was focused on AFOs in 1999 when the United States Department of Agriculture (USDA) and the Environmental Protection Agency (EPA) released the Unified National Strategy for Animal Feeding Operations. The primary goal of the strategy is to minimize impacts on water quality and public health from AFOs. Decision Support SystemIn 1998, with the funding from the U.S. Department of Agriculture's Natural Resources Conservation Service (NRCS), the Earth Sciences and Resources Institute at the University of South Carolina (Esri-USC) began development of the Decision Support System for Animal Feeding Operations for use in Marion County, South Carolina. Marion County is located in the coastal plain of South Carolina. This area is generally characterized by highly permeable soils, a high water table, and numerous streams and wetlands. According to 1997 figures, 33 percent of the State's swine production is concentrated in a three-county area that includes Marion County.
The Decision Support System, a GIS-based application, can be used to identify whether an area meets the legal requirements for siting an AFO or for manure application according to the regulations of the South Carolina Department of Health and Environmental Control (SCDHEC). More important, the Decision Support System qualifies legal siting areas based on environmental factors--either on a watershed basis or a site-specific basis-so that individual agricultural by-product management plans can be developed. In addition to its use for siting facilities, the Decision Support System can also assist in managing the relocation of nutrient-containing by-products through consideration of nutrient value and hauling costs, providing individual farm operators with valuable information previously unavailable. Version 1 of the Decision Support System was completed during 1999. Data UsedThe Spatial Simulation Module spatial data layers are shapefiles, grids, and image files. The shapefiles contain data on streams, soils, wetlands, common land units (CLUs), and locations of AFOs. The streams data layer consists of a Topologically Integrated Geographic Encoding and Referencing (TIGER/line) file. The soils layer represents the Soil Survey Geographic (SSURGO) data set obtained from USDA-NRCS. The wetlands layer was derived from Landsat imagery. The CLU layer was digitized by Esri-USC from digital orthophoto quarter quads (DOQQs) provided by USDA-NRCS. The CLUs are comprised of property parcels or tracts and the farm field(s) contained within each tract. ArcView Spatial Analyst, an extension to ArcView GIS, was used to create the 50-meter grids that were used for analysis. The setback grids represent the distance to waters, distance to property lines, and distance to wells. The environmental grids contain data on wetlands; soils erodibility data derived from the USDA-NRSC soils database; and data, indicating watershed contamination by fecal coliform, zinc, and copper, that was created using monthly water quality data from ambient stream-monitoring stations maintained by SCDHEC. Each grid layer was normalized from 0 to 1, with 0 representing the least ideal location and 1 representing the most ideal location. An Overview of the Decision Support SystemThe Decision Support System, launched from ArcView GIS, consists of two components-the Spatial Simulation Module and the underlying Microsoft Access database. The ArcView GIS GUI, modified by the Spatial Simulation Module, contains the AFO toolbar, a collection of buttons that were developed by Esri-USC using Avenue, ArcView Dialog Designer, and Visual Basic controls. The Spatial Simulation ModuleThis component of the Decision Support System uses functionality from the ArcView Spatial Analyst extension to generate grids for the selection of AFO locations and waste utilization areas, calculate net manure hauling costs, and score fields for land application.
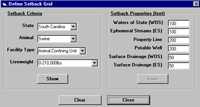
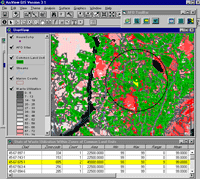
The user is presented with the setback form that will be used to generate the selection grids. The setback properties, based on the type of animal production and the size of the proposed or existing operation, consist of the distance to waters, distance to property lines, and distance to potable wells. If the setback values are changed, a new setback grid is created by using the map query process in ArcView GIS. For example, if the setback for the property lines equals 100 feet, the grid for Distance to Property Lines is queried by using the expression "Distance to Property Lines > 100". The grid cells that match the query are given a value of 1. Grid cells that do not match the query are given a value of 0. The user is prompted with the grid scoring form for selection of AFOs or waste utilization areas. The form allows weighting of the importance of any given grid or suitability criterion. To create the scoring grid, the application uses map algebra. The program multiplies each grid layer by the weight and a setback grid, and then it sums each cell into a composite output grid. The scoring grid clearly shows the acceptable sites for building AFOs or optimal areas for waste utilization. Waste areas are characterized with values ranging from 0 to 100, with a value of 0 denoting the least optimal area and a value of 100 indicating the most optimal site.
Placing a new AFO is the next step. An economics form allows the user to input information about the proposed facility such as type and live weight of the animals, waste management system, and the method used to transport waste. The unit value of the manure is assumed to be equal to the current market price for bulk fertilizer with an equivalent nitrogen/phosphorus/potassium composition. The hauling cost is a function of a user-defined operating cost, hauling distance (one-way or round-trip), vehicle and load size, and vehicle speed. For a given solid or liquid waste, the economics form can simulate three hauling scenarios-the break-even hauling distance, the resulting net unit value of waste given some specified hauling distance, or the hauling distance given some required net unit waste value. The information input by the user is calculated by the economics form and written to a shapefile. Finally, agricultural fields within the hauling distance are scored for suitability for land application of animal wastes. The summary statistic is computed for each selected field within the hauling distance based on the scoring grid cell values that fall within each field polygon. The mean values of the field polygons are ranked from the lowest to the highest. Underlying DatabaseAn Access database stores temporal data associated with the AFO and CLU themes. After selecting an AFO point, the user can view the National Pollutant Discharge Elimination System (NPDES) permit number, type of animal raised, and manure production and analysis history for the last five years. The attributes for CLU polygons are displayed in a similar fashion. The user can view data such as information on AFO permitting for land application, soil test results, crop nutrient recommendations, and waste applications. Specifically, the AFO waste management information used for permitting allows the user to determine if the CLU where land application occurred is owned by the animal producer. Future DevelopmentsThe second version of the application is scheduled for deployment in 2000. The user interface has been modified so data may be more easily entered in the Access database. The user will be able to select fields for land application and rank these fields based on the scoring grid and the distance from the AFO facility. The scoring function will calculate manure application requirements for each selected field based on the area, crop grown, and phosphorous and potassium levels. Another aspect of the project is the development of the Web-based GIS application using MapObjects Internet Map Server (IMS). The Web-based application will provide a convenient way to access and display spatial data as well as query the database. The Decision Support System now operational in Marion County, South Carolina, will be implemented in Marlboro County, South Carolina. Depending on the availability of funding, the plan for 2001 to 2004 is to expand the concept to seven counties in South Carolina. ConclusionThe Decision Support System for Animal Feeding Operations Siting and Management application provides a scalable and robust tool for field-level implementation of Source Water Assessment and Protection Plans amendments as well as the Unified National Strategy for Animal Feeding Operations. The customized application allows a novice GIS user easy access to AFO and CLUs information. It provides the flexibility to update the Access database and to integrate more data sources into the Decision Support System. About the AuthorsElzbieta Covington is a GIS specialist at the Earth Sciences and Resources Institute, University of South Carolina. She has a master's degree in geography from the University of South Carolina at Columbia and has more than 10 years of experience applying GIS to environmental problems. Robin "Buz" Kloot is involved with a number of programs at the Earth Sciences and Resources Institute dealing with environmental, economic, and related technical issues. His bachelor's degree is in chemical engineering, and he has a master's in business administration from the University of South Carolina. Buz has 14 years of technical and operational experience in the mining and environmental industries. James "Buddy" Atkins is a commissioner in the Public Services Commission of South Carolina. Prior to his appointment, he was a research associate professor at the Earth Sciences and Resources Institute, University of South Carolina. He has a doctorate in marine science from the University of South Carolina. His research interests include surface water hydrology, water resources systems operation, and optimization and nonpoint source pollution monitoring. ResourcesFor more information on this project, contact Elzbieta Covington. | ||||||||||||||||||||