|
The Magazine for
Esri Software Users |
|
|||
Modeling CAD Data in ArcView GISBy Mike Price, Esri
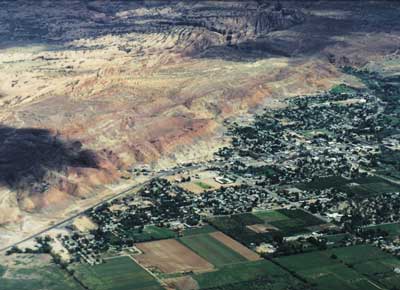
Engineering professionals in many industries such as transportation, civil engineering, construction, mining, and emergency management produce Computer Aided Design (CAD) data that can be useful for GIS. CAD maps are often created in local coordinate systems or even in "paper inches," rather than coordinates that are useful for GIS. Engineers manage spatial data by separating it into many named or numbered layers or levels and may assign elevation values to CAD entities or even build drawings in true three-dimensional space. Using the CAD Reader extension that comes with ArcView GIS, CAD data can be loaded into a project. CAD data can be transformed from local coordinates to coordinate systems used in GIS by applying a world file to CAD themes created from CAD data. This article explains how to separate the data by the layers defined in the source CAD drawing, create thematic legends that represent various feature types, and use a world file to register themes created in local coordinates into a coordinate system that can be used in GIS. About the ModelThe CAD data for this exercise was provided by the Moab City Planning Department. Moab, located on the Colorado River in southeastern Utah, is a popular vacation destination for mountain bikers and outdoor enthusiasts. It will also be the site of the 2000 Southwest User Group (SWUG) meeting to be held in early November 2000. The area covered by this data includes a part of town known fondly to old timers as "Steenville." Charlie Steen, Moab's 1950s era Uranium King, platted this area. The model includes data for the homes built on land provided by Steen for the miners who swarmed to Moab nearly 50 years ago to mine the exotic yellow mineral. It also contains data on the larger bosses' homes, several churches, and a school.
The model includes "Mi Vida," Steen's own castle, which sits high on the east side of the valley overlooking Steenville. The data used in the exercise consists of a CAD drawing (DWG) file, shapefile, digital elevation model (DEM) data file, and a world file. The CAD data was developed by an engineering firm for the City of Moab, is maintained by City engineers, and is used here by permission.
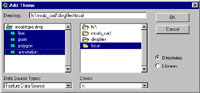
Getting the Sample DataBefore starting ArcView GIS, set up the directory structure shown in Figure 1 using Windows Explorer or another file management program. These folders will hold the sample data and the files created while doing this exercise. The data for this exercise is contained in the file MoabCAD.zip. Download the data now. Use WinZip to extract moabtopo.dwg, moabroad.avl, moabroad.dbf, moabroad.shp, moabroad.shz, wldfile1.wld, and moab1158.dem files. Place these files in the subdirectories created in the previous step. Using CAD DataBefore a CAD drawing can be used by ArcView GIS, the CAD Reader extension must be loaded. CAD data files will not be visible unless this extension is loaded. When adding a DWG file to an ArcView GIS project, notice that the file displays both folder and theme marker icons. Click on the folder icon to expand the DWG file and display the line, point, polygon, and annotation layers it contains. Multiple themes can be created from a single CAD data source.
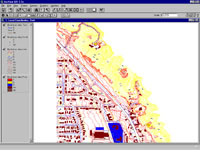
This is a small CAD file that should load quickly. If it loads successfully, the four data types and their associated legends will appear in the Table of Contents in the ArcView GIS view. If a DWG file does not contain a particular data type, that data will not appear in the Table of Contents. The file name for each theme created from a data type is the same as the name of the DWG file. Click on each theme and choose Theme > Properties to rename each theme with a name that describes the type of data it contains (e.g., Moabtopo.dwg Line for the line layer). Drag the Moaptopo.dwg Poly theme to the bottom of the Table of Contents. Make all themes visible and zoom in slightly. Save the project again. Filtering CAD DataDWG files contain spatial entities that are separated into different groups or layers. The CAD Reader extension alphanumerically sorts the layers contained within a theme. CAD engineers often freeze or turn off layers to hide them or protect them from editing.
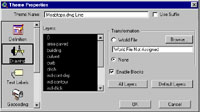
When adding CAD data with the CAD Reader, always use Theme Properties to verify that all layers are available. CAD drawing data can be easily filtered and specific data thematically displayed by copying a data theme to the ArcView GIS clipboard and pasting it back into the View. Individual layers in a copied theme can be turned on individually or in small groups and new thematic legends applied. Click on a theme and choose Theme > Properties. In the Theme Properties dialog box, select the Drawing feature. The text box in this dialog box will display all the layers contained in that theme that were originally created by Moab's engineers in CAD. These layers can be independently selected. Holding down the Shift button while clicking on several layers selects them for inclusion in one operation. After opening each theme in the Drawing feature dialog box, click the All Layers button to include all the CAD layers in this theme.
Notice the unusual numbering system shown in each legend. Initially, colors are mapped using a Unique Value profile based on the CAD pen color. There seems to be a system at work here, but without a detailed explanation, the nature of that system is not apparent. In the Table of Contents for the View, double-click on the legend for each theme to bring up the Legend Editor. Use the drop-down box to change the Value Field from Color to Layer. Select one of the color ramps under Color Scheme for each theme and apply the changes for each theme before closing the Legend Editor. A theme showing just elevation will be created by extracting the contour lines from Moabtopo.dwg Line using the Drawing feature found in the Theme Properties dialog box.
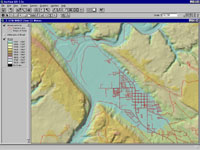
Adding DEM DataThis project can be made more visually interesting by using a hillshade theme created using DEM data as a brightness theme for the thematically displayed DEM data. The DEM file, moab1158.dem, can be converted to a grid file that can be used by ArcView Spatial Analyst.
Moving CAD Data into Project Space with a World FileFor many years, surveying in the Moab Valley was tied to a local coordinate system registered in feet even though Grand County often created data in metric coordinates projected in Universal Transverse Mercator North American Datum of 1927 (UTM NAD27) Zone 12. By using a world file, Moab Valley data can be positioned in the UTM space. A world file is a one- or two-line text file that includes the x and y coordinates of a CAD point, first in local coordinates, then in UTM coordinates and has a WLD extension. The coordinate pairs are separated by a space. A single line world file will register a drawing on a new point, effectively moving it. The two-line world file with the sample data, wldfile1.wld, rotates, rescales, and moves themes created from the Moabtopo.dwg file.
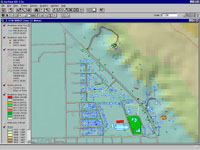
Magnify the View to verify that the CAD-based themes have been successfully transformed and are visible. Use the Edge of Pavement themes from the Moab Valley and Grand County to compare the linesets. These linesets should have a pretty close fit. The greatest differences occur in the northeast part of town, in the cliff area near Charlie Steen's house on the hill. These differences exist because the data for this area was developed from a different set of aerial photographs that were flown at a different time.
There is an easier way to apply world files. When a world file is given the same root name as the DWG file to be transformed and is stored in the same directory, ArcView GIS (with the CAD Reader extension loaded) will automatically reregister the CAD data as it is loaded into a View. A world file can be created in WordPad or any similar text editor. Make sure that the file is saved with a WLD extension. SummaryUsing the CAD Reader extension and the Drawing feature in the Theme Properties dialog box, CAD data can be filtered. CAD data can be transformed from a local coordinates to projected coordinate space by creating and applying a world file. Once transformed, CAD data can be combined with vector and grid data in an ArcView GIS project. ResourcesVisit "Terrain Modeling with ArcView GIS" to download lessons based on articles that have appeared in ArcUser describing how to use data available from the USGS EROS data Web site with ArcView GIS, ArcView Spatial Analyst, and ArcView 3D Analyst. The data formats included are:
| |||||||||||||||||||||||||||||||||||||